U.S. Water Use Declines, But Points to Troubling Trends, Says USGS Report
U.S. Geological Survey’s newest five-year report (2000-2005) reveals positive trends and potential problems for U.S. water use.

by Andrea Hart
Circle of Blue
U.S. water use is at its lowest while the economic productivity of water in the country is at an all-time high, according to a USGS report released Tuesday.
Every five years since 1950 the USGS assesses U.S. water use. The latest study, which examines usage from 2000 to 2005, shows a continued trend of more efficient water in the country. Per-capita water use has dropped almost 30 percent since 1975.
Both irrigation and industrial water usage were the most improved, according to USGS officials. These developments are large in part from an increase in water quality regulations, according to Chief of the USGS Office of Groundwater Bill Alley.
2005 Total Water Withdrawal in Millions of Gallons/Day (Mgal/d) — Google Fusion Table
“You have to meet certain requirements for discharge and that’s an incentive to decrease the amount of water that you’re using,” he told Circle of Blue.
But the study also reveals worrisome regional trends, according to water experts at the Pacific Institute.
“The good news is at the national level, water use isn’t growing, the bad news is that in many parts of the U.S. demand is growing and scarcity is becoming more of a problem,” said Dr. Peter Gleick, President and Co-founder of the Pacific Institute. Gleick said that increased demand for water in the Southwestern and Southeastern U.S. has put further strain on the already depleting resource.
States that used the most water for domestic and commercial use, known as public supply withdrawals, included California and Florida. Despite scarcity issues, both states used roughly 2,000 to 7,000 million gallons per day in 2005. California is currently undergoing internal political struggles over water legislation while Florida continues to work through its tri-state legal battle with Georgia and Alabama over Lake Lanier.
More than half of the Western U.S., especially California, has been gripped by drought conditions, according to the Department of Agriculture and the National Oceanographic and Atmospheric Administration’s weekly U.S. Drought Monitor.
And population growth has compounded these scarcity issues, according to Gleick.
“We’ve seen populations growing really fast in regions of the country where water use is higher,” he said. The Pacific Institute’s response to the USGS report, released Thursday, highlighted that “household water use is growing at the same rate as national population” and that there has been a “shift in population to hotter, drier regions.”
Alley agreed that population growth, especially in already large states, has contributed to resource competition.
“I think it’s obvious from looking at water situations across the country that there’s a lot of competition irrespective that total water withdrawal remains static,” he said.
And while the U.S. has permitted economic and population growth without increasing water demand, he warned that the country should continue this efficiency trend.
States that Decreased Total Withdrawal from 1995 to 2005 in Mgal/d — Google Fusion Table
“If this doesn’t continue we’re in big trouble, because we’re already running into serious regional constraints on water availability,” he said.
“We could greatly improve irrigation efficiency, we could greatly further reduce domestic, that is residential and commercial demands for water.”
Resources
Download the full USGS report or the abstract.
What do you see in the numbers?
We want to hear from you. data@circleofblue.org
For more on U.S. water trends see Circle of Blue’s series “Water Issues Dividing and Challenging the U.S.”
Andrea Hart is Circle of Blue’s assistant news editor. Reach her at andrea@circleofblue.org
Pacific Institute: Fact Sheet on Water Use in the U.S.
• The United States continues to improve water-use efficiency
• New data from USGS shows both improvements and worrisome trends
New information from the U.S. Geological Survey shows that total water use in the United States in the five-year period ending in 2005 dropped slightly from 2000. Moreover, total water use, for all purposes, is now lower than it was in 1975. Figure 1 shows total U.S. water withdrawals from 1950 to 2005. Per-capita water use has dropped even more dramatically over the past three decades. At the same time, the economic productivity of water – measured as dollars of GDP produced with every hundred gallons of water used in the U.S. – continues to improve. But, according to a Pacific Institute analysis, there are some worrying trends.

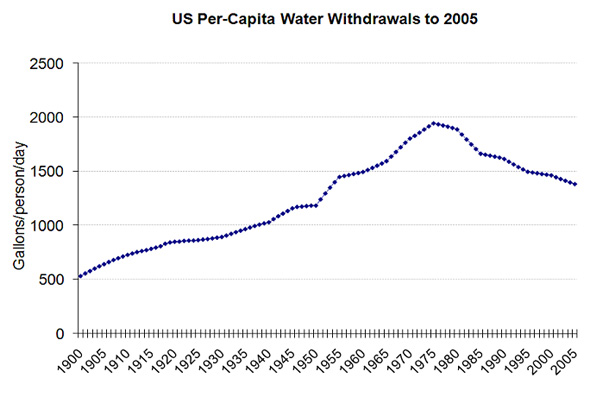
According to the new figures, released every five years by the USGS, total water use in the U.S. decreased by one percent from 2000 to 2005 (the most recent year for which numbers are available), while the population of the country grew by 5%. The amount of water used per-person in the U.S. is lower now than it has been since the mid-1950s. And per-capita water use in the nation has dropped nearly 30% from its peak in 1975. Figure 2 shows per-capita water use from 1900 to 2005. Water use per person in the U.S. peaked in 1975 and has been declining since, as efficiency of water use has improved, especially in irrigation and industrial water use.
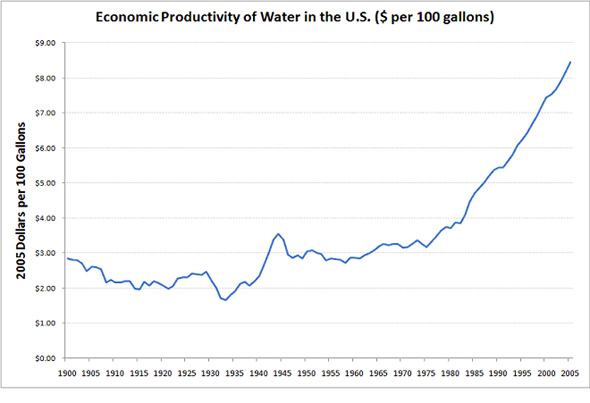
Water planners and managers always assume that as populations grow, and as economies grow, that water use will also grow. This is no longer true, as limits to water resources become more apparent and severe, and as improvements in technologies and management approaches permit efficiency of use to improve. Figure 3 shows the “economic productivity” of water use in the United States, as calculated by the Pacific Institute, from 1900 to 2005. This figure measures the dollars of gross domestic product (GDP) produced with every 100 gallons of water used. The U.S. now produces far more wealth, with far less water, than at any time in the past.
Not all the news about water is good: The United States, although relatively water-rich, faces a range of threats to its vital supplies of freshwater. Overuse has turned the Colorado River into little more than a trickle. Overuse and contamination threaten the massive Ogallala aquifer, which runs from Texas to South Dakota and is an important source of irrigation and drinking water. Political and economic conflicts are growing between Alabama, Florida, and Georgia over water use. And other serious threats to our water resources – including climate change, wetland destruction, and population growth – remain unaddressed.
Selected Data Facts from the Pacific Institute analysis of new USGS data:
- Total water use in the U.S. in 2005 is lower than it was in 1975.
- Per-capita water use in the U.S. in 2005 is lower than it has been since the mid-1950s.
- U.S. water use, per person, peaked in 1975 at 1944 gallons per person per day and has now dropped to 1383 g/p/d.
- Household water use is growing at the same rate as national population. Improvements in water-use efficiency in homes are being balanced by a shift in population to hotter, drier regions.
- The economic productivity of water (dollars of Gross Domestic Product per unit of water used) is higher than it has ever been: it has nearly tripled since the 1970s, to $8.45 of GDP produced per hundred gallons used from only $3.18 in 1975 (in 2005 dollars).
Sources
Pacific Institute
U.S. Geological Survey



The government should find ways on how to address this problem. the report is pretty alarming. They should find solutions not only on the present problems but also on the upcoming ones. they should begin to anticipate now and begin to think of plans on how to address it.
The report at least made us aware of this issue regarding water consumption.
The government should find ways on how to address this problem. the report is pretty alarming. They should find solutions not only on the present problems but also on the upcoming ones. they should begin to anticipate now and begin to think of plans on how to address it.