Infographic: Map of Pollution Levels in China’s Major River Basins
The seven major river basins, as a whole, have had steady improvements in water quality over the past decade.
The water quality of the Pearl River and the Yangtze River are the best among the seven major river basins. There have been few changes to the Hai River over the last decade, while there was a big increase in water classified as drinkable (Grades I-III) in the Yellow River. The Huai River has had a relatively stable improvement, but the Songhua River has experienced slow improvement from 2004 to 2007 (perhaps due to two catastrophic pollution accidents that occurred there in 2005 and 2006).
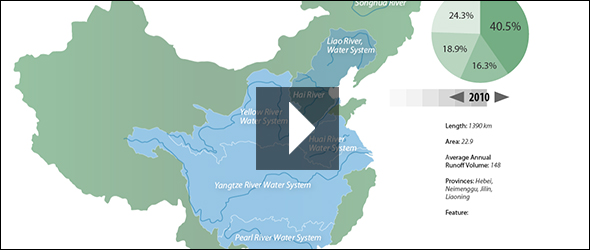
Click through the interactive infographic below to view China’s seven major river basins and how the water quality of each river has changed over the past decade.
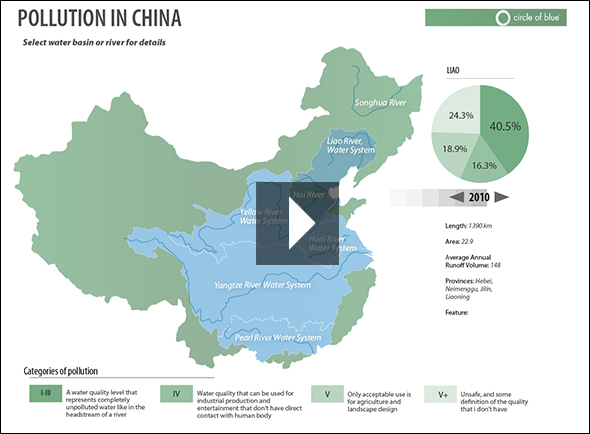
Infographic by Mark Townsend, a recent graduate of Ball State University‘s journalism graphics program. Townsend is a Traverse City-based designer for Circle of Blue and can be reached at circleofblue.org/contact.
Data collection and research led by Zifei Yang, a research intern with the D.C.-based China Environment Forum at the Woodrow Wilson International Center for Scholars. Additional contributions by Nadya Ivanova, a Chicago-based reporter for Circle of Blue, and Jennifer Turner, director of the China Environment Forum. Reach Ivanova at circleofblue.org/contact.



I went to know introduction of water treatment for beer industry