U.S. Groundwater Losses Between 1900-2008: Enough To Fill Lake Erie Twice
Groundwater depletion in the United States has accelerated over the last decade, according to the U.S. Geological Survey, contributing to both localized problems and global issues, like sea level rise.

By Brett Walton
Circle of Blue
Groundwater is often compared to a bank account. By this analogy, the United States is making significantly more withdrawals than deposits, according to the U.S. Geological Survey’s first national assessment of groundwater depletion.
–Leonard Konikow, hydrologist
U.S. Geological Survey
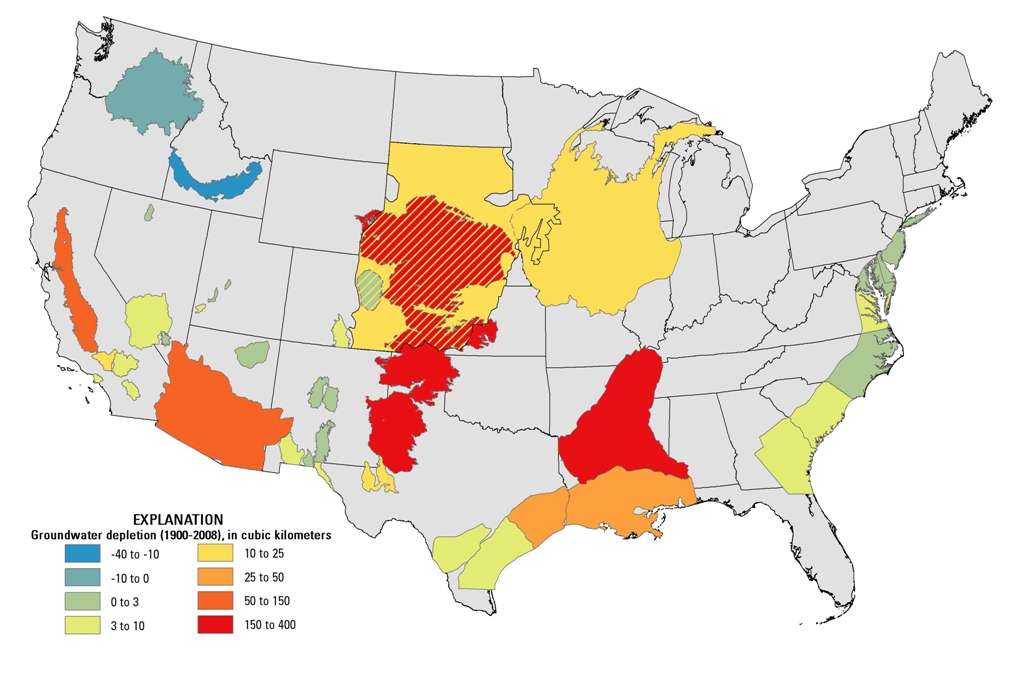
Between 1900 and 2008, U.S. groundwater reserves dropped by nearly 1 trillion cubic meters (264 trillion gallons), or enough water to fill Lake Erie — twice.
And the problem is getting worse. The rate of depletion from 2000 to 2008 was nearly three times greater than the average rate of depletion for the entire study period.
Groundwater is a vital part of the country’s water supply system, accounting for one out of every five gallons withdrawn according to the U.S. Geological Survey. Falling groundwater tables have prompted Texas to sue New Mexico this year over the effect on flows in the Rio Grande. Wells are dropping in much of the High Plains, leading to higher energy costs for irrigation and new pumping restrictions. Groundwater depletion in the U.S. even affects global sea levels.
One Report, Dozens of Stories
The study looked at 40 major aquifer systems, so there are dozens of local stories held within this one report. The broader narrative, however, is clear, the report’s author told Circle of Blue: national groundwater use is on an unsustainable course.
“In many of these systems, we’re removing water faster than it is being replenished,” said Leonard Konikow, a U.S. Geological Survey hydrologist. “That is not sustainable in the long run.”
Two out of every three gallons of groundwater in the U.S. is used for irrigation, and the biggest depletions occurred in prime farming territory: the Mississippi River Delta, the Central Valley of California, and the Southern Great Plains, which draws from the renowned Ogallala Aquifer, the Fort Knox of the country’s subterranean water banks.
Because of recent drought, wells have dropped even lower in the last three years, according to state and local data — declines that did not factor into the USGS analysis. The Texas Water Development Board, for example, reported a median decline of 1.5 meters (4.8 feet) in 101 of its 110 monitoring wells in 2011. The remaining nine wells in its network saw an increase in water levels.
Some areas, particularly the state of Arizona, have taken steps to curb groundwater use. Arizona passed a groundwater management law in 1980. The conversion of thirsty farmland around Phoenix into suburban sprawl has helped, too, as has the delivery of Colorado River water, which is pumped underground to top off the aquifers. Deliveries to Phoenix, via the Central Arizona Project canal, began in 1985. Groundwater reserves in the state are now recovering, but reliance on a Colorado River that already promises more water than it can deliver — and whose flows could be cut as much as 9 percent by 2060 because of climate change — is a risky long-term proposition.
Other aquifers in the USGS study also benefited from canal systems that brought surface water from afar. Two aquifers in the Pacific Northwest actually saw net increases in groundwater storage over the entire study period. But those trends have reversed in the last few decades, and both the Columbia Plateau and the Snake River Plain aquifers have been running deficits since the 1970s, when farmers developed groundwater irrigation schemes.
Local Solutions, Local and Global Effects
Groundwater is typically controlled locally in the United States, resulting in a buffet of strategies to cope with the declines. Pumping restrictions are common, used in Texas and Kansas. Also in Kansas, Wichita is injecting flood waters underground, and farmers in northeast Oregon want to do the same with a small fraction of the Columbia River’s winter flows. Meanwhile, land-fallowing programs have sprouted in Colorado.
A number of effects follow extensive groundwater pumping. For one, it can siphon water away from rivers. In January, for instance, Texas filed a lawsuit in the U.S. Supreme Court alleging that groundwater withdrawals in New Mexico were cutting into its share of the water from the Rio Grande.
Another problem is that if too much pumping happens, the land can drop along with the water table, a process called subsidence. Stretches of California’s Central Valley have dropped several meters in elevation since widespread pumping began there in the 1920s.
The least well known effect is on sea levels. According to Konikow’s calculations, roughly 1.3 percent of global sea level rise in the 20th century and 2.3 percent of the rise from 2000 to 2008, when pumping accelerated, can be attributed to groundwater depletion in the United States — and that is just the contribution from one country. Add the rest of the world, and groundwater withdrawals are responsible for 6 percent of the observed rise in the oceans, Konikow reckons. (Other estimates have put the figure several times higher, but Konikow told Circle of Blue that those studies overstate the effect.)
Konikow acknowledges that his estimates for U.S. groundwater depletion are not perfect. Scientists cannot measure the volume of an aquifer directly. Instead, they extrapolate from various measurements, based on well depths and the porosity of soils. Konikow told Circle of Blue that the margin of error for the study is approximately 20 percent above and below the 1-trillion-cubic-meter (264-trillion-gallon) estimate of depletion.
Brett writes about agriculture, energy, infrastructure, and the politics and economics of water in the United States. He also writes the Federal Water Tap, Circle of Blue’s weekly digest of U.S. government water news. He is the winner of two Society of Environmental Journalists reporting awards, one of the top honors in American environmental journalism: first place for explanatory reporting for a series on septic system pollution in the United States(2016) and third place for beat reporting in a small market (2014). He received the Sierra Club’s Distinguished Service Award in 2018. Brett lives in Seattle, where he hikes the mountains and bakes pies. Contact Brett Walton


You also have to take into account the wealthy retirees that move into what are arid, and semi-arid areas then want all their greenery around them, places like Arizona, that require vast amounts of water just to keep green in a climate that these plants are not native to, and would quickly wither, and die without all this water. Also, all those millions that choose to live in what are essentially deserts, Southern California amongst them, that require way more water than the area can provide, so they pump it from far away, draining water resources from those areas. This makes as much sense as those that keep on living in flood plains, getting flooded out, then rebuilding in the same places, at the taxpayers expense, of course, those that build their multi-million dollar homes on slide prone hillsides, and those that build their homes on the water’s edge in hurricane prone areas. You pay for what you CHOOSE to do! Or, should I say the entire population, at least those that actually pay taxes, insurance premiums, and utility rates, pay for.
Interesting to see my current hometown of Reno not exhibiting loss. The Truckee Meadows were once a sweeping wetland which emigrants had to carefully pick their way through while enjoying the wet as respite from the harrowing traverse of the 40 Mile Desert. For centuries the wetlands have trapped and percolated snowmelt runoff from the eastern Sierra, the major showpiece of which is the Truckee River, the only outlet of vast Lake Tahoe. The river flows east and north into elegiac Pyramid Lake. Since 1998, the last of the South Meadows wetlands has been filled in, paved over and great channels to remove flood water have been engineered as Army Corps of Engineers mitigation policy for housing developments. Recharging of aquifers seems nearly impossible any longer, though the local water authority claims the area can sit out a prolonged draught with those stores. With recharging at a standstill, I expect to see the color changing between Tahoe and Pyramid lakes in future maps.
Billy,
The aquifer beneath Reno was not one of the 40 assessed in the report, so it wouldn’t show up on the map. You are correct that the Truckee Meadows area is being depleted. This USGS report, using data from 2000, shows a net groundwater decrease but the numbers are old and the methods rudimentary.
http://pubs.usgs.gov/sir/2004/5239/sir2004-5239.pdf
Brett
Brett,
When you write that “…but reliance on a Colorado River … whose flows could be cut as much as 9 percent by 2060 because of climate change”, is that a fact or is it just an opinion by most climate scientists?
I ask this because I’ve heard that global warming will alter weather patterns of our planet but not decrease the amount of rainfall it receives and that is to early to tell exactly what areas will receive more rainfall and which ones will receive less. Am I wrong?
Kenneth,
The 9 percent figure (8.7 percent to be more precise) comes from the Interior Department’s study of water supply and demand in the Colorado River Basin, released December 2012. That study used 112 different climate projections and came up with an average (mean) 8.7 percent reduction in flows compared to the historical record, 1906-2007. Some projections showed an increase in flows, but most showed a decrease. (See pg SR-23: http://99.198.125.162/~circl731/wp-content/uploads/2012/12/StudyReport_FINAL_Dec2012.pdf)
Scientists can’t put an exact number on how climate change will affect any particular river, but the rule of thumb for future projections is that dry areas get drier and wet areas get wetter. The Colorado River Basin falls under the “drier” category. The timing and distribution of precipitation will certainly change.
Brett
Another great synopsis of the big picture issues. The 9% reduction in Colorado River availablity will certainly be felt by all users of this relatively small river. Each year I watch for the Colorado River Board of California Meeting notes, to give me a summary of each state’s use in the Lower region.
http://www.crb.ca.gov/meetings.html
Year CA AZ NV Total Acre-Feet
2012 4,420,000 2,796,000 236,000 7,452,000
2011 4,175,000 2,800,000 300,000 7,275,000
2010 4,363,000 2,792,000 243,000 7,398,000
2009 4,364,000 2,827,000 248,000 7,439,000
2008 4,506,000 2,780,000 267,000 7,553,000
2007 4,374,000 2,798,000 308,000 7,480,000
2006 4,304,000 2,811,000 306,000 7,421,000
2005 4,355,000 2,436,000 288,000 7,079,000
2004 4,314,000 2,784,000 284,000 7,382,000
2003 4,355,000 3,008,000 311,000 7,674,000
2002 5,311,000 3,056,000 308,000 8,675,000
As you can see, over the past 10 years, a lot of progress has been made despite an increasing population in the Desert Southwest. I am sure that more will follow as the reality of a lost surplus becomes obvious to those that rely on the Colorado River.
This website’s Pacific Institute has continually provided a wealth of data and insight into the issues and logistics of providing water for an increasing DSW population, an example being:
http://www.pacinst.org/wp-content/uploads/2013/02/full_report38.pdf
Keep up the great work.
Although not directly related to this article, I’d like to pass on a fascinating study put together by the Civil Society Institute. Their report is report aimed at reviewing all of the factors involved with power production that the Clean Energy Standard (CES) lacked, in their opinion, due to the political process.
http://www.civilsocietyinstitute.org/media/pdfs/091912%20Hidden%20Costs%20of%20Electricity%20report%20FINAL2.pdf
The report’s references alone, found in the back of the report, are worth the download.