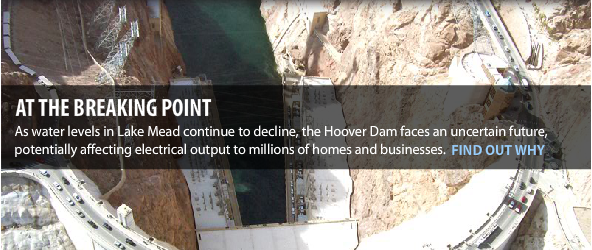
Infographic: Hoover Dam’s Troubled Waters
A decade-long drought in the Colorado River Basin–along with over-allocation and a warming climate–have lowered Lake Mead by 133 feet as of July 8, 2014, a drop which has threatened the dam’s ability to produce power.
Click through the tabs of the interactive infographic below to visualize different scenarios and statistics.
Lake Mead has continued to drop since this visualization was first published in 2010. As of July 8, 2014, the region is in a 14-year dry spell, and Lake Mead has gone from 41 percent full in 2010 to only 39 percent full — the graphic has been updated to reflect these changes.
A visualization of Hoover Dam’s production capacity throughout a persistent decade-long drought that threatens to halt its power. Click on the tabs within the graphic for more information. If you are having trouble viewing this graphic click here.
Graphic created by Ball State University graduate students Daniel Cooper and Danielle Aber, with data compiled by Circle of Blue’s Brett Walton. Contact Brett Walton


Circle of Blue provides relevant, reliable, and actionable on-the-ground information about the world’s resource crises.




Leave a Reply
Want to join the discussion?Feel free to contribute!