Animation: Progression of Wildfires in the United States
Wildfires rage in drought-stricken California and are becoming more prevalent across the country.
On Sunday, California Governor Jerry Brown declared a state of emergency in Lake and Napa counties as the Valley fire (now spanning 67,000 acres) burned homes and property. The Valley fire is one of the many wildfires raging in the dry state – click here for a real-time map of California wildfires.
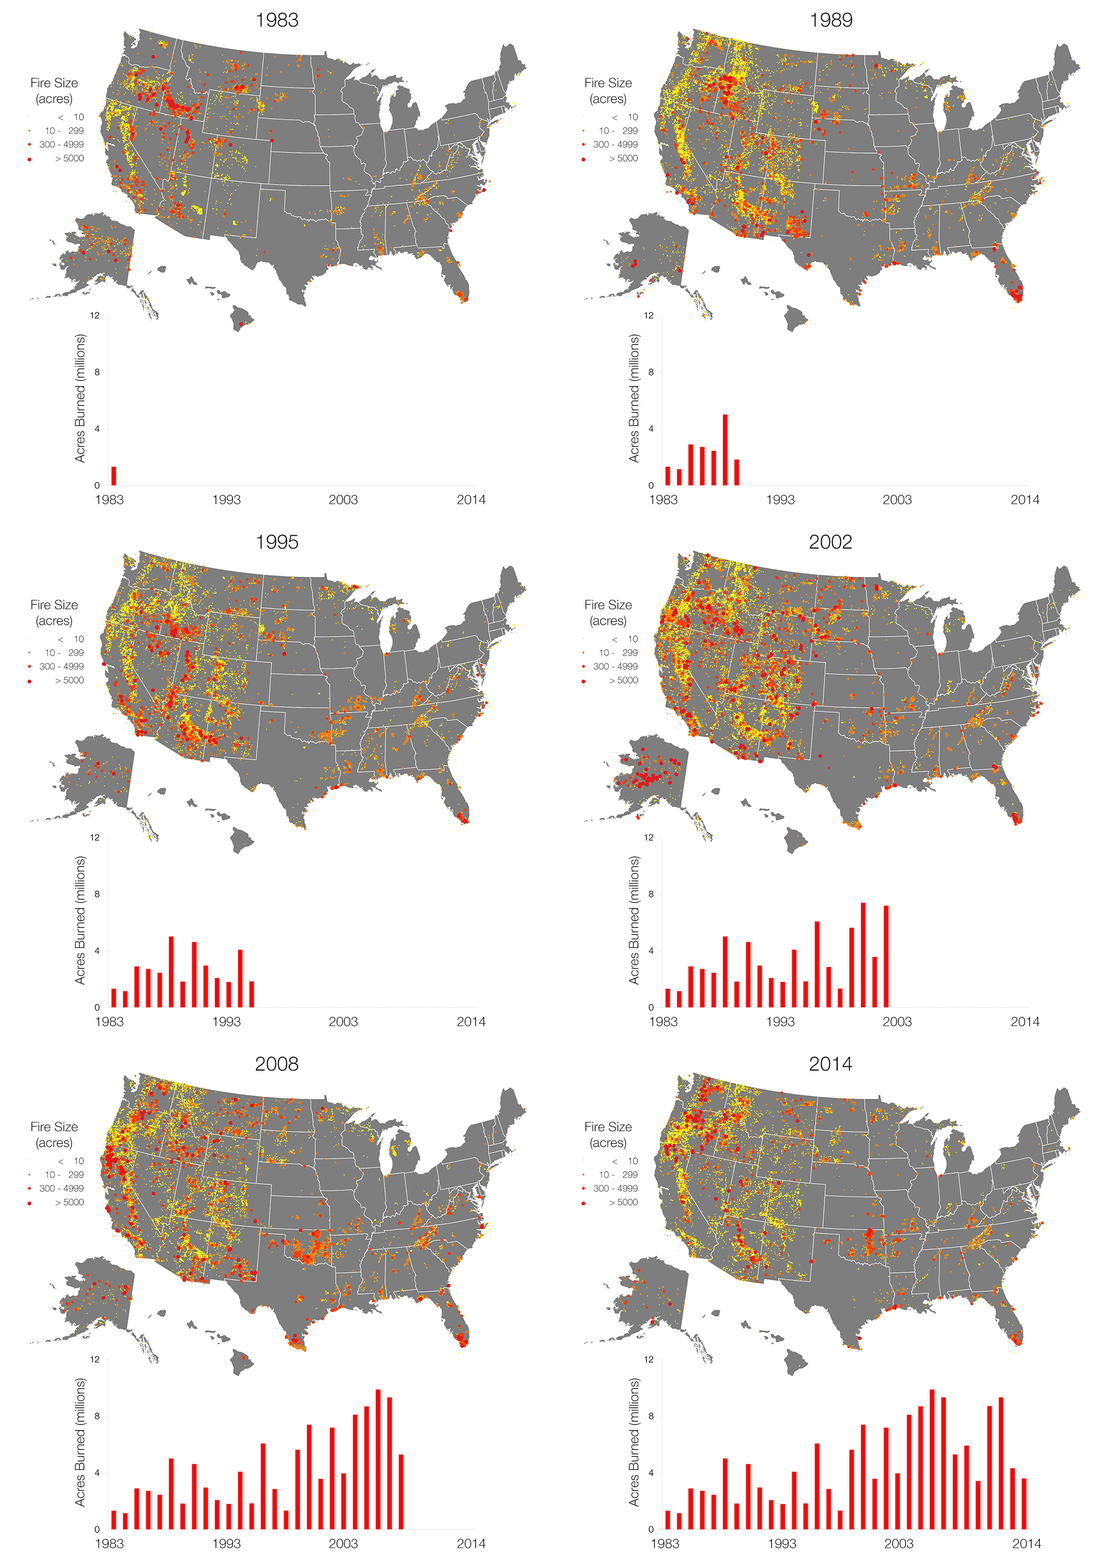
While hot, dry conditions put the spotlight on California, the rest of the United States isn’t in great shape when it comes to wildfires, either. According to The U.S. Forest Service, climate change has increased the length of the fire season by 78 days as compared to 1970. Annual acreage burned has doubled in the past 30 years, and is projected to double again by mid-century.
This animation visualizes wildfires in the United States from 1983 to 2015. The maps show the location and size of fires. The bar chart at the bottom shows the total acreage burned.







Leave a Reply
Want to join the discussion?Feel free to contribute!