Infographic: 2015 Price of U.S. Water, Sewer, and Stormwater
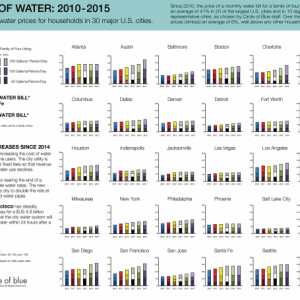
Map of the cost of water service in 30 major U.S. cities.
The price of a monthly bill for water, sewer, and stormwater service varies greatly across the United States. Since 2010, Circle of Blue has tracked water prices for 20 of the largest U.S. cities and for 10 regionally representative cities. However, 2015 is the first year that the annual survey includes both sewer and stormwater prices, as well.
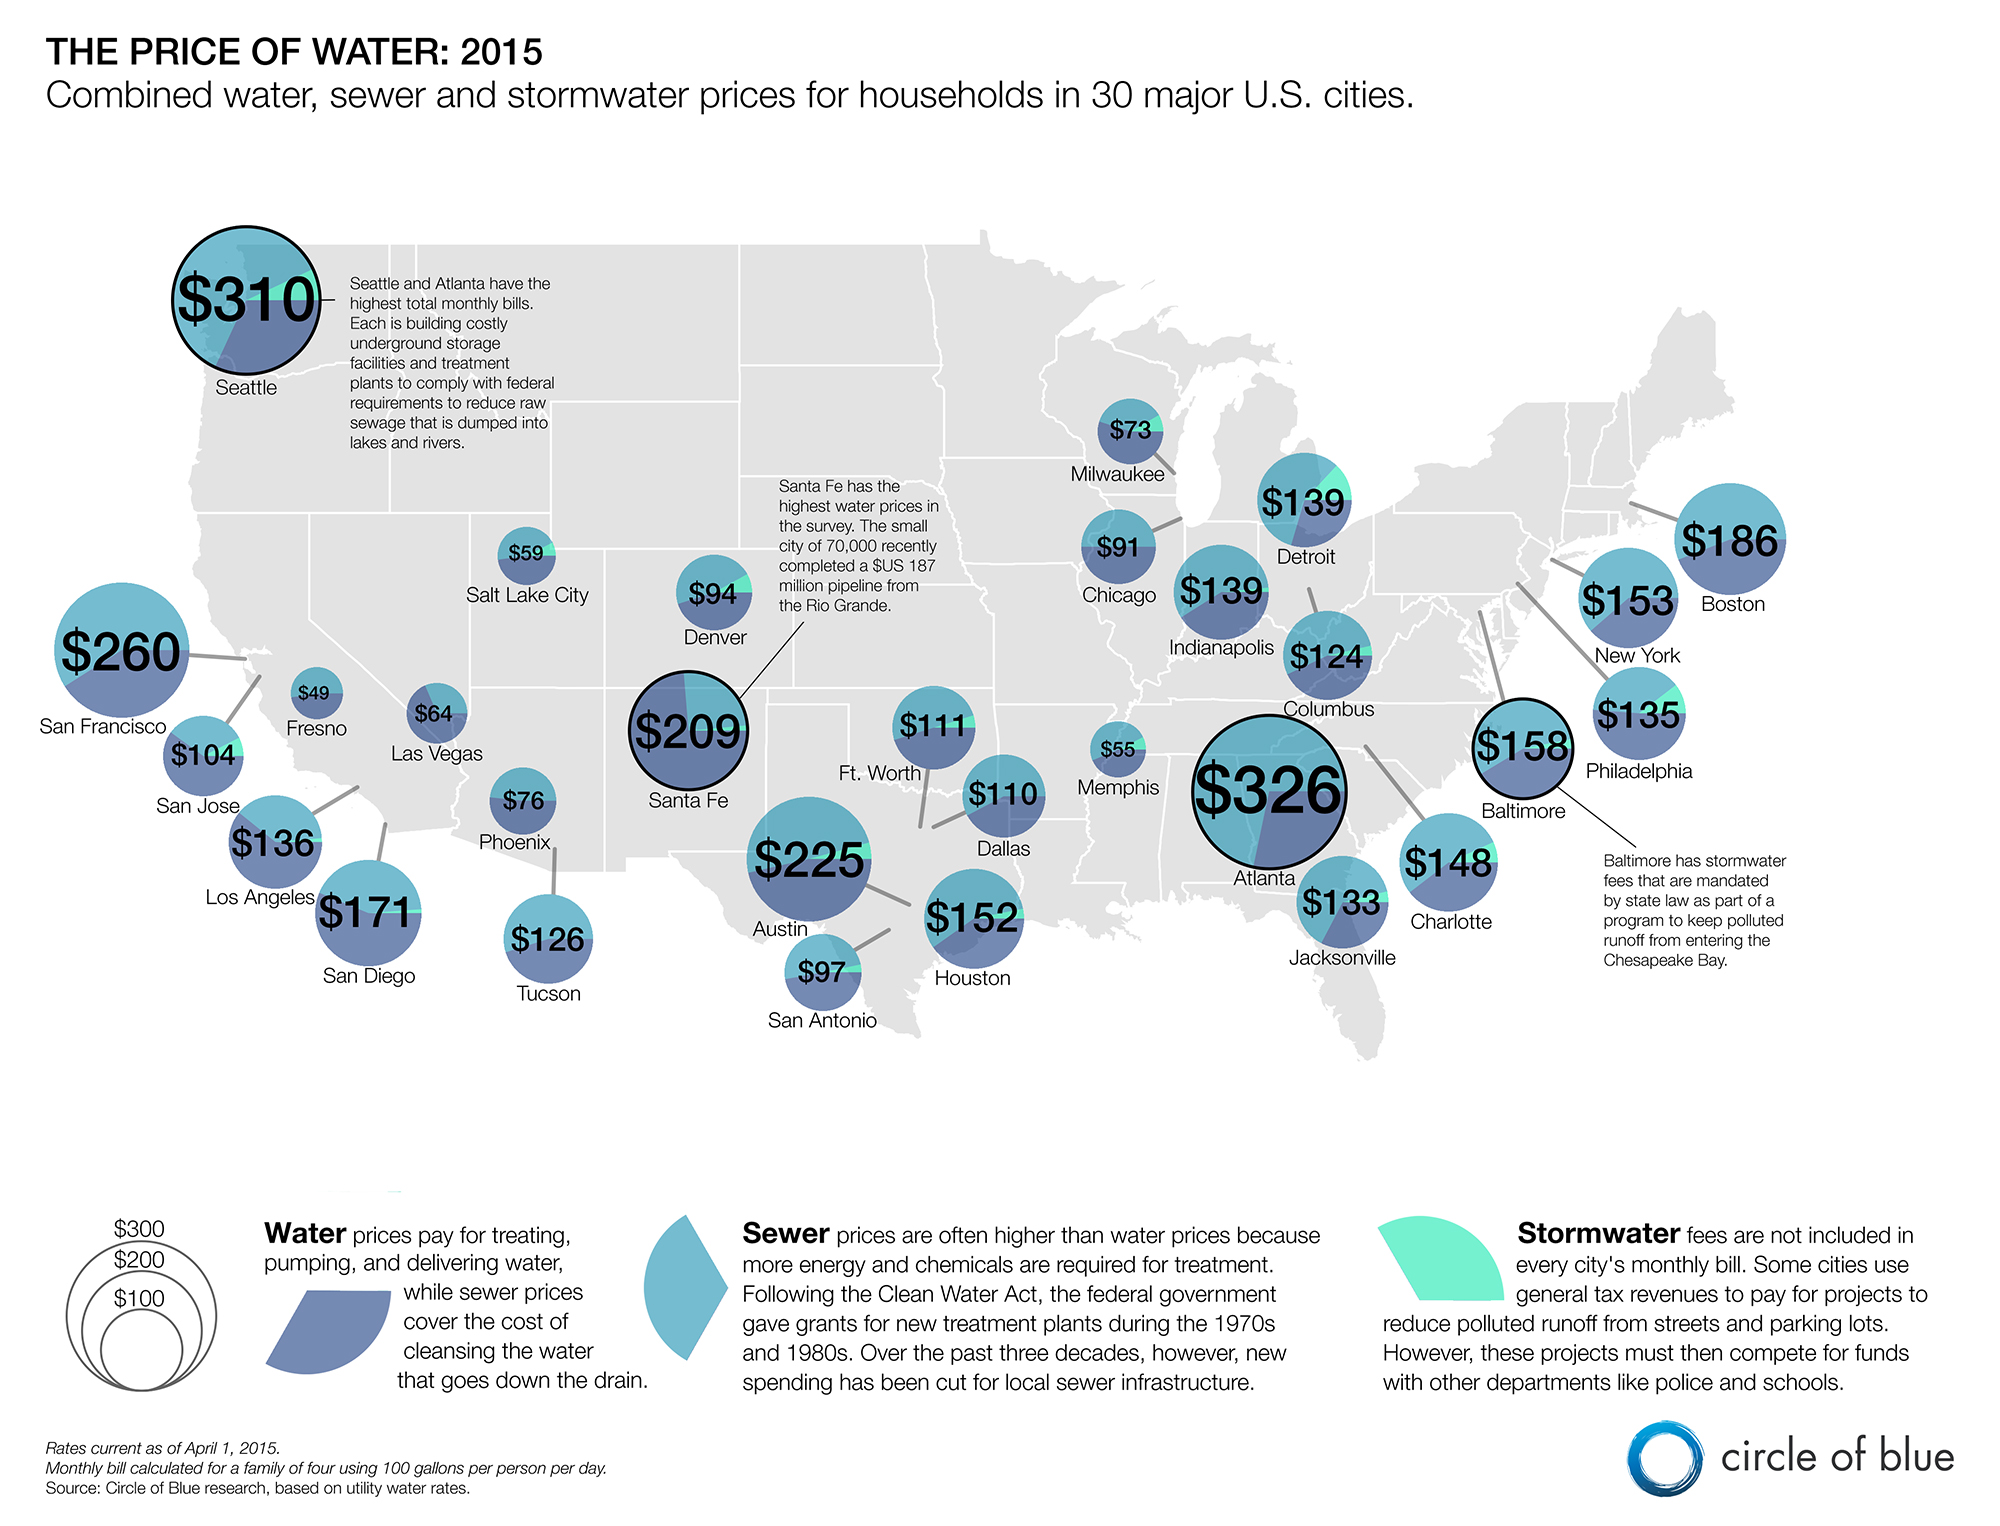
The map below shows the average monthly cost for a family of four using 380 liters (100 gallons) per person per day in each city. The cost of water comes in three parts:
- Water prices pay for treating, pumping, and delivering water, while sewer prices cover the cost of cleansing the water that goes down the drain. The average price of residential water increased by 6 percent between 2014 and 2015 and 41 percent since 2010, according to Circle of Blue research.
- Sewer prices are often higher than water prices for two reasons. First, treating sewage requires more energy than treating drinking water. Second, sewer infrastructure is expensive to build, and cities are constructing more treatment facilities, tunnels, and storage tanks to comply with federal regulations.
- Stormwater fees are not included in every city’s monthly bill. Some cities use general tax revenues to pay for projects to reduce polluted runoff from streets and parking lots. However, these projects must then compete for funds with other departments like police and schools.
The size of the pie charts on the map correspond to the size of the monthly bill in each city, while the colors indicate what percentage of the bill comes from each service: the price of water is shown in purple, sewer in blue, and stormwater in green. Residents in each city might see the charges on separate bills, but they have been combined in this infographic to show the total cost of clean water.
The numbers on the infographic do not reflect an actual average household bill for residents of these cities. The data show the wide variations in water prices across the United States if the same volume of water — in this case, 1,500 liters (400 gallons) per day — was used in each city. An average bill depends on how much water is used. High rates, such as in Seattle and Atlanta, and high use equals a higher bill than high rates and low use. Residents can lower their bill by using less water.
Water
Santa Fe has the highest water prices in the survey. The New Mexico capital is a smaller city – some 70,000 – but it recently completed a large infrastructure project, a pipeline from the Rio Grande that cost the city $US 187 million. Fewer customers for an expensive project means higher individual bills.
Fresno had the lowest prices, but that will soon change. Fresno’s rates bounced up and down in the last year as the City Council revoked a rate increase after civic pressure. Rates, however, will nearly double over the next five years to pay for a $US 429 million plan to invest in new water- supply and -treatment facilities.
Sewer
Following the signing of the Clean Water Act in 1972, the federal government provided grants to cities for new sewage-treatment plants. In the last three decades, however, the federal government cut spending for sewer infrastructure. The cities with the highest sewer prices are those building new infrastructure without federal subsidies. Atlanta, Indianapolis, and Seattle are among the more than 40 large cities that are addressing pollution from sewer systems that transport both sewage and runoff from city streets, systems that are known as combined sewers. Consequently, Atlanta and Seattle have the two highest combined water, sewer, stormwater prices in the survey.
Combined Sewer and Stormwater
The U.S. Environmental Protection Agency’s combined sewer policy came out in 1994, but it takes time and money to work through enforcement. Every year, more cities sign a consent decree with the EPA. When cities sign a decree, they usually agree to expand storage and treatment capacity to reduce the amount of polluted runoff during rainstorms. Building underground holding tanks and tunnel systems is expensive, often a multibillion-dollar project for a large city. The EPA is working with cities to incorporate wetlands, grassy streetside buffers, and other rain-absorbing “green” infrastructure to reduce the cost of building new hardware.
Separate fees for stormwater are an increasingly common way to pay for new sewer systems that will deal with rain and snowmelt. Most fees are no more than $US 5 per month and are based on the amount of hard surface — driveways, roof, pavement — located on a property. Local governments establish most stormwater fees, but a few are mandated by state law. Baltimore is one of several Maryland cities that are required to charge a stormwater fee to reduce polluted flows into the Chesapeake Bay.
This infographic was made to accompany Brett Walton’s story Price of Water 2015: Up 6 Percent in 30 Major U.S. Cities. Contact Brett Walton or send a tweet to @WaltonWater.
is both a scientist and a journalist, she holds an MS in Environmental Engineering from Michigan Technological University, and she brings proficiency in ESRI’s ArcGIS mapping software.




Trackbacks & Pingbacks
[…] Aging infrastructure and shrinking urban populations mean that water bills can increase in costs. This infographic from Circle of Blue highlights the cost of the monthly bill in various US cities, and what percentage of […]
[…] to the non-profit organization Circle of Blue, there are two main reasons why the sewer bill is likely to be higher than your water […]
Leave a Reply
Want to join the discussion?Feel free to contribute!