Price of Water 2015: Up 6 Percent in 30 Major U.S. Cities; 41 Percent Rise Since 2010
As urban water use declines, utilities change business models.
By Brett Walton
Circle of Blue
In the decade following World War Two, America’s cities, resurgent from an economic depression and powerful in the wake of a global military triumph, installed and expanded the far-reaching water supply networks that propelled a generation of widespread economic growth, prosperity, and improvement in public health.
Facilities to cleanse the nation’s waterways of harmful pollutants and organic wastes followed in the 1970s thanks to generous federal grants and civic outrage at burning rivers.
The results of those investments — the thousands of miles of distribution pipes beneath city streets, the lengthy water transport and treatment infrastructure — are now cracked or brittle. The bill to repair and renew America’s long-neglected water systems is coming due.
We expect water rates to continue to grow above inflation for some time. We don’t see an end in sight.”
–Andrew Ward, director of U.S. public finance
Fitch Ratings
Rebuilding will not be cheap but it is achievable.
Continuing a trend that reflects the disrepair and shows no sign of slowing, the price of residential water service in 30 major U.S. cities rose faster than the cost of nearly every other household staple last year, according to Circle of Blue’s annual water pricing survey.
The economics of water — particularly the cost of treatment, pumping, and new infrastructure, as well as the retail price for consumers — gained renewed prominence as California and Texas, America’s two most populous states, face historic droughts and water managers seek to rein in water consumption, with price increases as one tool in their arsenal.
The average monthly cost of water for a family of four using 100 gallons per person per day climbed 6 percent, according to data collected from the utilities. It is the smallest year-to-year change in the six-year history of the Circle of Blue survey but comparable to past years. The median increase this year was 4.5 percent. In comparison, the Consumer Price Index rose just 1.8 percent in the 12 months ending in March, not including the volatile food and energy sectors. Including food and energy, prices fell by 0.1 percent.
For families using 150 gallons and 50 gallons per person per day, average water prices rose 6 percent and 5.2 percent, respectively.
The survey results reflect broad trends in the municipal water industry that nearly every U.S. utility must grapple with, according to Andrew Ward, a director of U.S. public finance for Fitch Ratings, a credit agency.
Distribution pipes, which can branch for thousands of miles beneath a single city, have aged beyond their shelf life and crack open daily. Some assessments peg the national cost of repairing and replacing old pipes at more than $US 1 trillion over the next two decades. In addition, new treatment technologies are needed to meet Safe Drinking Water Act and Clean Water Act requirements, and cities must continue to pay down existing debts. At the same time, conservation measures have proven successful. Utilities are selling less water, but they still need big chunks of revenue to cover the substantial cost of building and maintaining a water system. All together, these and other factors amount to a persistent upward pressure on water rates.
“We expect water rates to continue to grow above inflation for some time,” Ward told Circle of Blue. “We don’t see an end in sight.”
Sewer Prices Higher Than Water
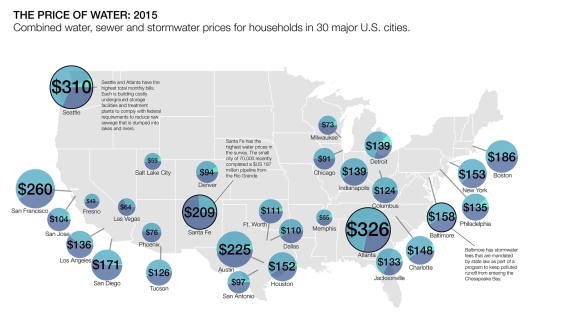
For the first time, Circle of Blue’s survey includes sewer prices and fees for controlling urban runoff from rainstorms. Together, the three charges — water, sewer, and stormwater — provide a complete picture of the rising cost of water for families in the country’s largest cities.
Atlanta ($US 325.52) and Seattle ($US 309.72) have the largest combined monthly charges for water, sewer, and stormwater for a four-person family at the 100 gallon per person per day level. Both cities have high sewer rates, which pay for multibillion-dollar investments in new treatment facilities. Both cities are also operating under legal agreements with the U.S. Environmental Protection Agency to reduce polluted sewer flows.
These agreements, called consent decrees, typically require massive investments in wastewater treatment capacity and affect more than 40 U.S. cities. Consent decrees and other EPA clean water mandates are the foremost drivers of sewer rate increases, according to Brent Fewell, a partner at the law firm Troutman Sanders and a former EPA assistant administrator for water. Federal grants that helped build the generation of sewage treatment plants in the decade following the passage of the Clean Water Act in 1972 have been cut by Congress and are not coming back, Fewell added in an interview with Circle of Blue. Cities now finance those projects on their own.
Memphis ($US 55.24) and Salt Lake City ($US 59.16) have the lowest combined monthly charges in the survey.
Conservation Success
Though rates are steadily increasing, residents are lowering bills by using less water.
Indeed, many households are conserving. Austin, Texas, for example, sold nearly 10 billion gallons less water in 2014 than in 2011, a 20 percent reduction. The city achieved this by dramatically increasing its rates for the highest-volume users while enforcing lawn-watering restrictions that were prompted by a record drought, according to David Anders, assistant director of finance for Austin Water.
Austin is not alone. Las Vegas, Los Angeles, and Phoenix are among the many cities where total water use is dropping. Nationally, residential water use dropped nearly 7 percent between 2005 and 2010, according to the U.S. Geological Survey.
“It’s an industry challenge right now,” Anders told Circle of Blue. “Even when we’re not under drought conditions we’re seeing per capita use go down.”
New Recipe for Revenue
Just as in the declining revenue available to build and repair highways — the result of rising costs, more fuel efficient vehicles, and less driving — financing water systems is a challenge because of the mismatch between the costs to operate a water utility and the utility’s revenue source. Roughly 80 percent of a utility’s costs — such as debt payments — are fixed, meaning they must be paid regardless of how much water is consumed. But residents pay for water primarily based on the volume used, which typically accounts for 80 to 90 percent of revenue.
The new reality for utilities is how to bring those numbers into closer alignment. And they must do so without making small amounts of water for basic needs unaffordable. Revenue stability, conservation, and affordability for the poorest residents: this is the juggling act at hand.
Ward of Fitch Ratings says he sees experimentation taking place as utilities are forced to confront the water-wise practices of the modern urbanite. But because utilities are inherently conservative institutions, those experiments are in increments, he says, not great leaps. Prices are primarily based on the cost to treat and deliver water. Though drought is reducing water availability across the West, few utilities include the scarcity of water in the price that residents pay.
The most daring of the 30 utilities in Circle of Blue’s survey, and an example of where the entire industry is headed, is Austin Water. After a revenue shock in 2010, Austin Water had to be bold. That year, the utility lost $US 53 million in revenue compared to its budget forecast, Anders said. A rainy summer meant that Austinites did not water their lawns as often and the utility did not sell enough of its product — water — to make budget.
An advisory committee set up in the wake of the shortfall recommended that Austin Water find financial footing by earning more dollars through fixed fees, which are paid regardless of the volume of water consumed. In response, the utility raised its fixed fee and added a second fixed fee that is based on consumption. The change was rapid. In 2011, fixed fees accounted for 11 percent of revenue. Today the share is 20 percent, and by 2017, fixed charges will rise to 25 percent of Austin Water’s income.
“More of our revenue is stable now during both drought and wet conditions,” Anders said.
Many utilities in California face a similar reckoning today as state regulators prepare mandatory water restrictions, Ward asserted. Larger utilities have cash reserves to endure a year of declining sales, but not all are in such financial health, he said.
The upheaval caused by changing patterns of water use are an opportunity for utilities to reevaluate long-term plans, argues Jan Beecher, director of the Institute of Public Utilities at Michigan State University. Are new supply projects necessary? Do managers need to worry about budgeting for expanded drinking water treatment capacity? Should rate structures be rebuilt?
“The whole idea of conservation and efficiency is to avoid variable costs in the short term and fixed costs in the long term,” Beecher explained.
Circle of Blue gathered water rate information from the website of each city’s water utility or from phone calls or emails to the utilities. Prices are based on single-family residential rates and are current as of April 1, 2015. Rates include fixed fees, volumetric fees, and surcharges. Average monthly prices for cities with seasonal rates were calculated using seasonal weighting. The fixed fees cited in the article are for 5/8 inch meters, the most common size for residential connections. Sewer prices are based on the same three tiers of water use as the water prices.
Brett writes about agriculture, energy, infrastructure, and the politics and economics of water in the United States. He also writes the Federal Water Tap, Circle of Blue’s weekly digest of U.S. government water news. He is the winner of two Society of Environmental Journalists reporting awards, one of the top honors in American environmental journalism: first place for explanatory reporting for a series on septic system pollution in the United States(2016) and third place for beat reporting in a small market (2014). He received the Sierra Club’s Distinguished Service Award in 2018. Brett lives in Seattle, where he hikes the mountains and bakes pies. Contact Brett Walton


Outdated water infrastructure is a matter of National security. But DC is strangely disinterested. Here’s an excerpt of a paper I wrote in 2008:
Every day in every state across the US, and in the periphery of everyday life, water is needed to sustain human life and lifestyles, maintain commercial business and industrial processes, irrigate agriculture, extract and generate energy and sustain ecological systems. When these water needs are satisfied the Nation as a whole is more secure and there is less likelihood of adverse societal, economic and environmental impacts (AWRA, 2007). Stated differently, the availability of usable state water resources is a significant component to the foundations contributing to US National security. Any “interruption or cessation of the drinking water supply can disrupt society, affecting human health and such critical activities as fire protection that can have significant consequences to the national or regional economies” (DHS, 2007, p. 14). Yet National water supply systems and the institutions they support are at risk.
AWRA (2007). Summary Highlights of the Third National Water Resources Policy Dialogue;
Suggestions and Guidance for Reexamining and Revising the Nation’s Water Policies. Third
National Water Resources Policy Dialogue. Arlington, VA: American Water Resources
Association, p. 6.
DHS (2007). Water, Critical Infrastructure and Key Resources Sector-Specific Plan as input to
the National Infrastructure Protection Plan. Department of Homeland Security & Environmental
Protection Agency, p. 134.