Mapping Thirst: New UN Graphics Predict Changes in Water Supply
The United Nations Environment Programme (UNEP) has recently updated a set of informative graphics to reflect fresh water availability worldwide, be it more or less. The project, called Vital Water Graphics, gives a comprehensive picture of the ways in which the amount of quality water available is changing. The Vital Water Graphics dynamically communicates several key statistics.
- Although almost half of the Earth’s land is covered in rivers, fresh water is not divided equally among all.
- Groundwater constitutes almost 100% of the fresh water upon which 1.5 billion people depend.
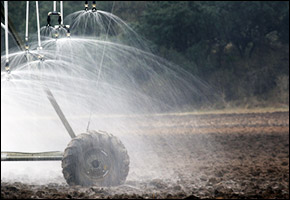
- Crop irrigation consumes almost 75% of this water.
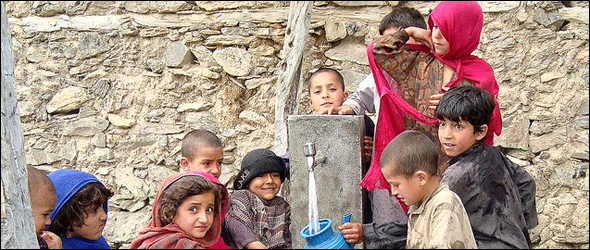
- Increasing population means fewer have access to clean water and sanitation.
“These graphics, together with accompanying texts and maps, highlight how the quantity, quality and availability of fresh and marine waters play a major role in determining levels and patterns of poverty, land degradation, pollution, sanitation, health, and rural and urban development around the world,” writes Achim Steiner, United Nations Under-Secretary General and Executive Director for the UNEP.
The graphics connect water usage to social, economic and environmental factors. They vary from charts recording water withdrawal and evaporation to maps displaying global fresh water use and access to sanitation. One set of maps predicts that India, China and the United States may experience a significant decrease in water supplies. Vital Water Graphics are tools designed to materialize the vision of the 1992 Rio Summit.
View the graphics here.
Source: UNEP





Leave a Reply
Want to join the discussion?Feel free to contribute!