Infographic: U.S. Power Sources
Producing electricity region to region.
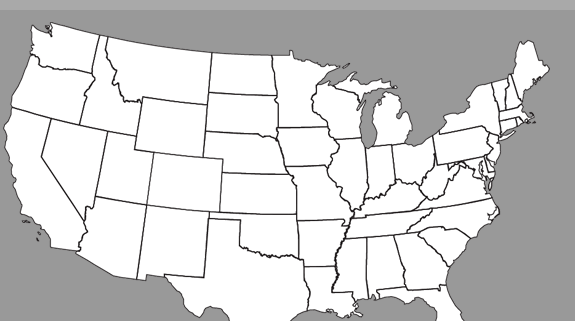
In addition to fossil fuels and nuclear power, the United States is tapping into renewable sources of energy such as biofuels and hydropower. The interactive infographic below compares electrical generating sources within each state.
Hover over an individual state to see its production source by percentage. Click the energy icons beneath the U.S. map to compare production capacity across the country. Click on “All Resources” at the top to return to the main menu map.
Graphic created by Ball State University graduate student, Danielle Aber, and data compiled by Circle of Blue’s Molly Walton. Reach Walton at circleofblue.org/contact.

Circle of Blue provides relevant, reliable, and actionable on-the-ground information about the world’s resource crises.


As far as power consumption goes, the smaller the water plant the less efficeint it is, right?