Infographic: Unprescribed — Drugs in the Water Cycle
In 2009, 3.9 billion prescriptions were dispensed in the United States, and an estimated 10 to 40 percent of medicines are not used. With 78 million baby boomers reaching the age when prescription drug use will increase, how will this affect environmental and drinking water?
The infographic below shows how these pharmaceuticals, if not properly disposed of, can end up in the water cycle.
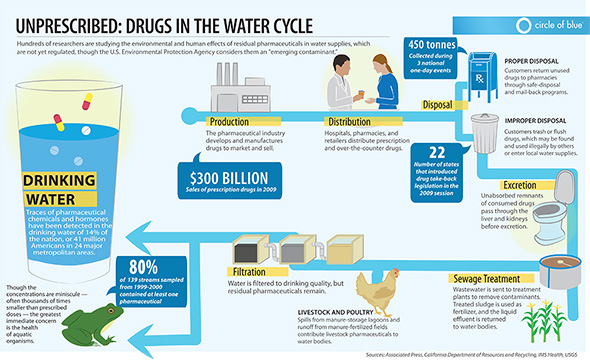
Infographic by Kelly Shea, a recent graduate of Ball State University’s journalism graphics program and a Seattle-based designer, for Circle of Blue. Shea can be reached at circleofblue.org/contact.
This graphic was made to accompany Circle of Blue reporter Brett Walton’s report, Unprescribed: Legislation to Keep Drugs Out of Water Thwarted by U.S. Pharmaceutical Lobbying




Scary numbers indeed. Is there a tolerance margin or this numbers are sign for an alert?