Infographic: What Is Your Water Footprint?
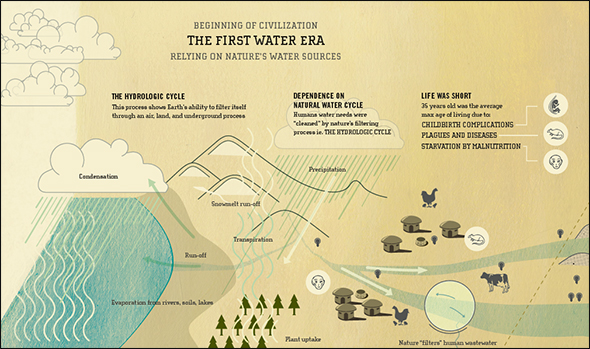
Winner of the 2011 Urban Water Design Challenge, sponsored by Visualizing.org and Circle of Blue.
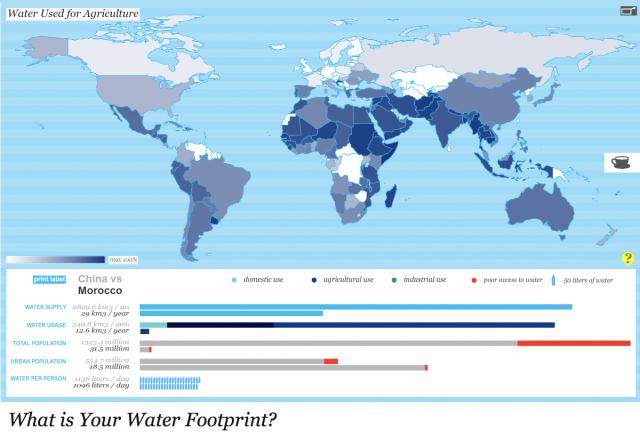
For their interactive water footprint graphic, Joseph Bergen and Nicki Huang—students at the Harvard Garduate School of Design—earned top honors in the Urban Water Design Challenge, sponsored by Circle of Blue and Visualizing.org. The winners were announced on March 22, the eighteenth annual World Water Day.

The winning graphic, “What is Your Water Footprint?”, explores water consumption based on location and lifestyle. In the first cartographic profile, users can scroll over different nations to compare details of urban population, water supply, and water usage by country. The second portion of the graphic depicts the virtual water embedded in different items, such as coffee and a computer chip.
See the other winning designs here.
Did you miss your chance to participate? Designers can continue to share their visualizations throughout the year by uploading to visualizing.org.
Circle of Blue provides relevant, reliable, and actionable on-the-ground information about the world’s resource crises.


Leave a Reply
Want to join the discussion?Feel free to contribute!