Infographic: American Plumbing — Tapping Into Water Infrastructure
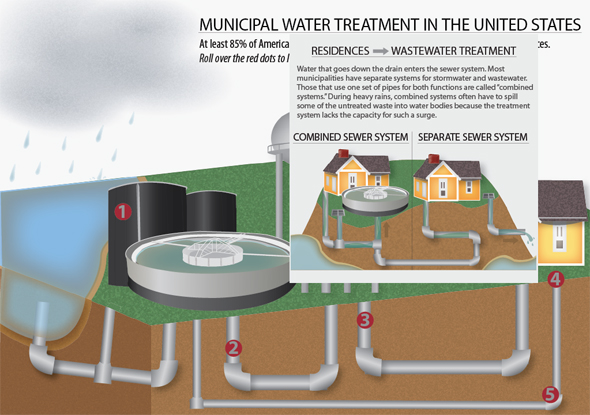
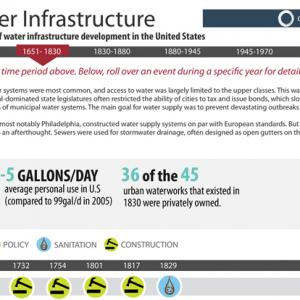
At least 85 percent of Americans use a municipal water system for drinking water or sewer services. This interactive infographic explains how water moves to and from your tap.
In the United States, turning on the tap and receiving clean water is viewed as so basic to the quality of life that many people take it for granted. But, as this detailed and interactive infographic shows, the process usually takes a series of reservoirs, pumps, pipes, and treatment plants — all of which require maintenance.
Source: EPA Office of Water, U.S. Geological Survey
Infographic by Tessa Tillett, a student of Ball State University’s journalism graphics program, for Circle of Blue, with contribution by Brett Walton, a Seattle-based reporter for Circle of Blue. This graphic was made to accompany Walton’s report, America’s Water Infrastructure Shows Its Age — The National Debate About How to Pay for Repairs. Contact Brett Walton
Circle of Blue provides relevant, reliable, and actionable on-the-ground information about the world’s resource crises.





Leave a Reply
Want to join the discussion?Feel free to contribute!