2012 Was Hot, Dry and Energy-Shifty in the U.S.
The data confirm it. Last year broke records for temperature and precipitation — and the trends continue.
In the coming days, Circle of Blue will publish its review of 2012 and its preview of 2013. Our stories, photographs and infographics tell the tale in their own stellar way, but recent summary data from federal agencies chisel 2012’s epitaph in cold, hard numbers.
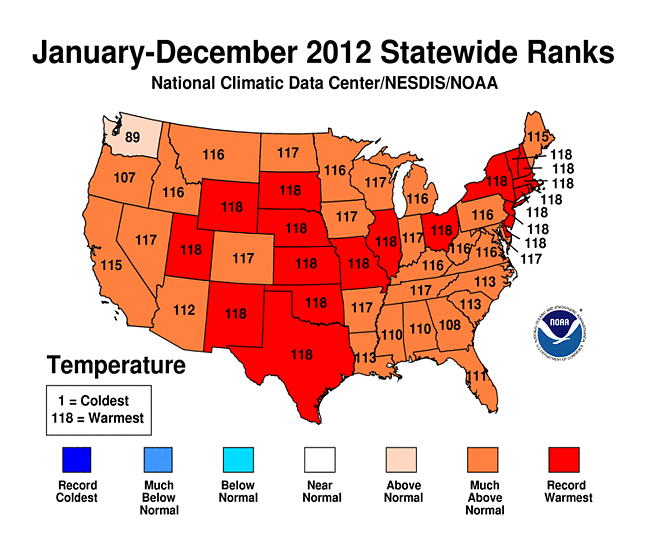
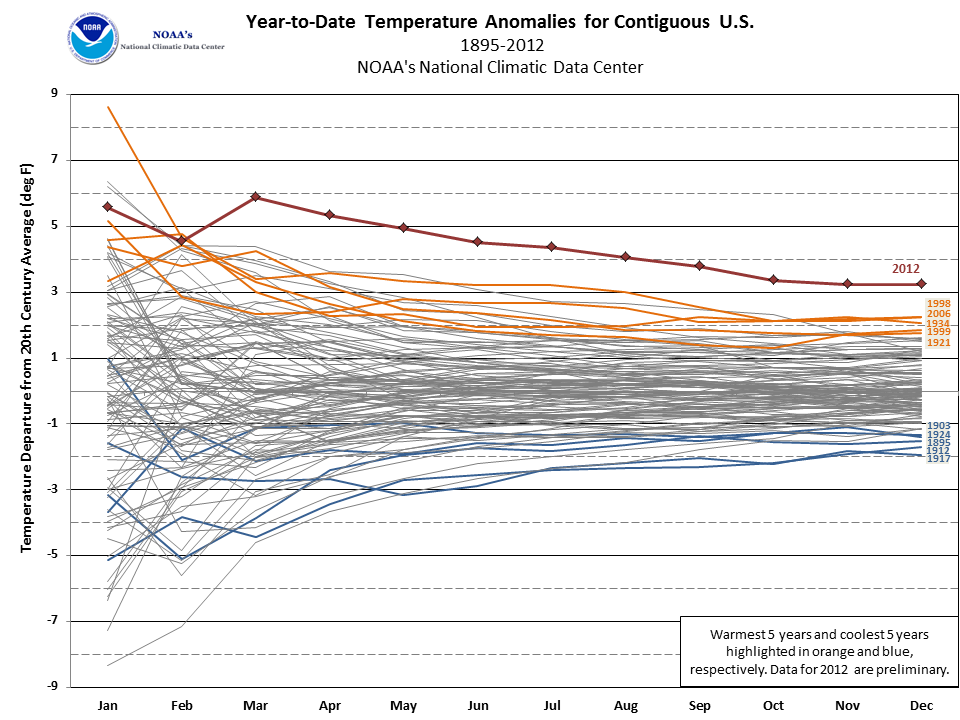
Yesterday the National Climatic Data Center confirmed what everyone knew to be true. Last year was the hottest in the 118-year historical record for the Lower 48 states. It was an outlier among outliers, a full degree Fahrenheit warmer than 1998, the former standard-bearer, and 3.3 degrees F warmer than the 20th century average.
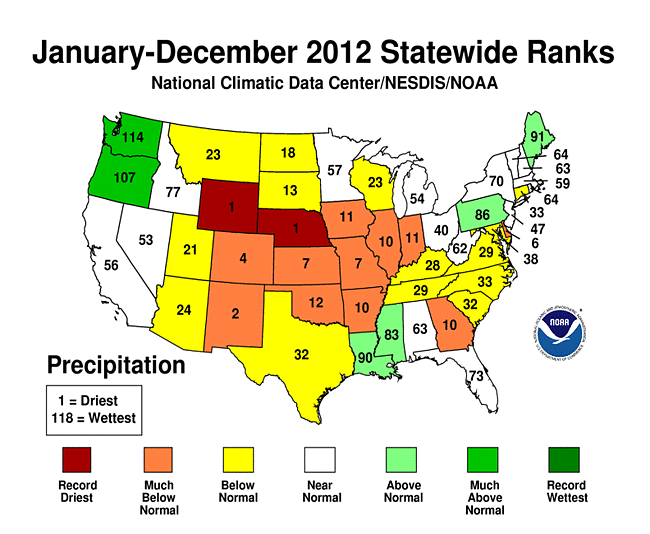
Not only was it hot. It was dry too. Two states, Nebraska and Wyoming, set records for lowest rainfall. Eight others had a top-ten dry year.
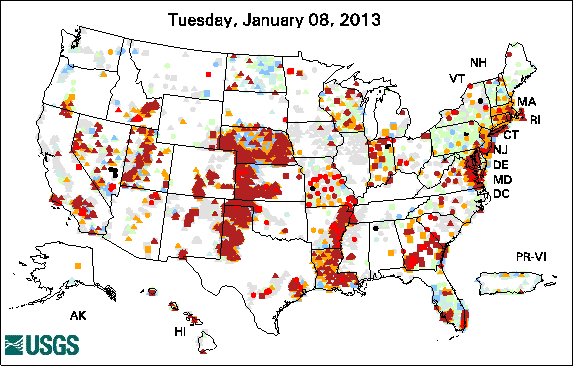
Dry above ground, less water below. If rivers shrivel, we tap that which is hidden. But groundwater levels, too, are below normal in most of the areas affected by the drought.
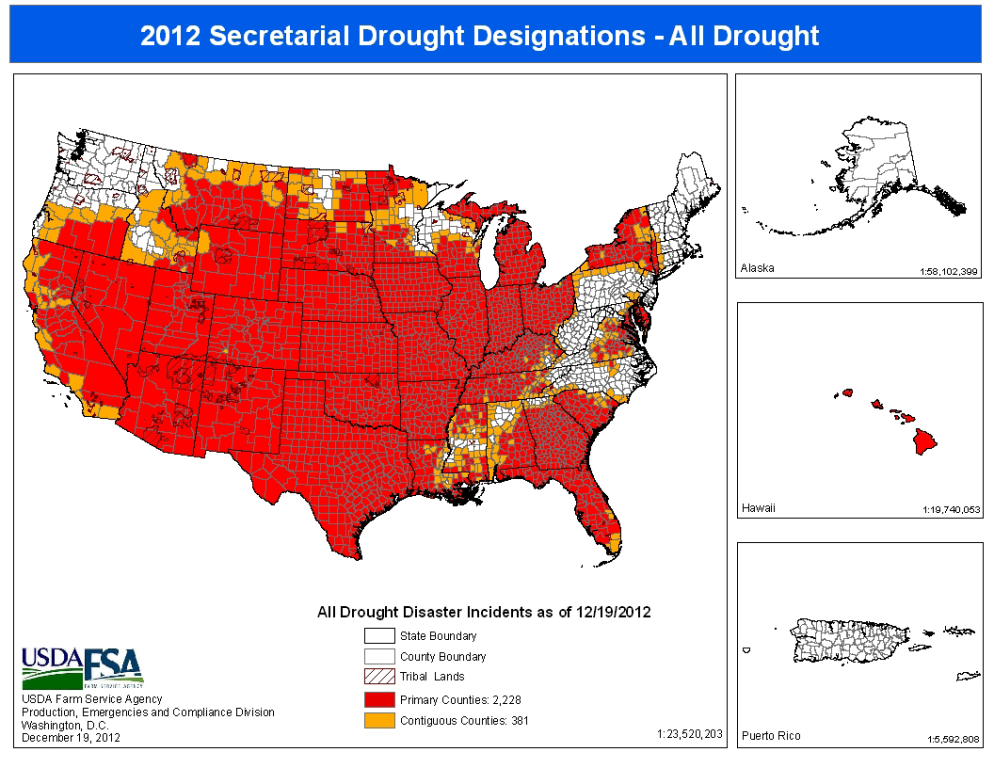
Often partners in arms, the heat and aridity led to the worst drought in the U.S. since the 1950s. Since July, roughly three out of every five acres in the Lower 48 states have endured drought conditions.
Five out of every six counties — 83 percent — is designated a drought disaster area.
Scant rain and higher temperatures mean more evaporation, which has hit the Great Lakes. Lake Michigan dropped to a record-low level in December.
Agriculture, too, was bludgeoned. Forecasted to set records, the corn crop failed in several states, resulting in the lowest production since 2006 and the smallest yields — 123 bushels per acre — since 1995, according to the Department of Agriculture. Soybeans yields were the lowest since 2003.
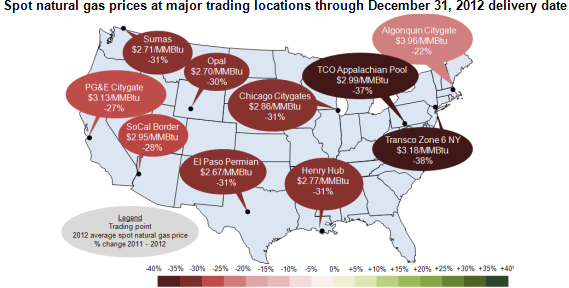
Commodity prices rose, but natural gas prices continued to fall. The average national price of natural gas dropped 31 percent in 2012.
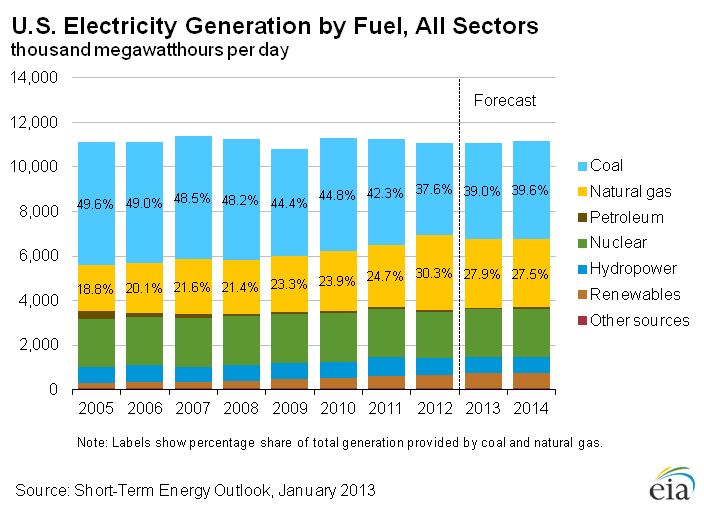
Power companies are sopping up the flood of cheap fuel, converting the nation’s stock of power plants from coal to gas. The Energy Information Administration, however, expects that trend to level off in the next few years.
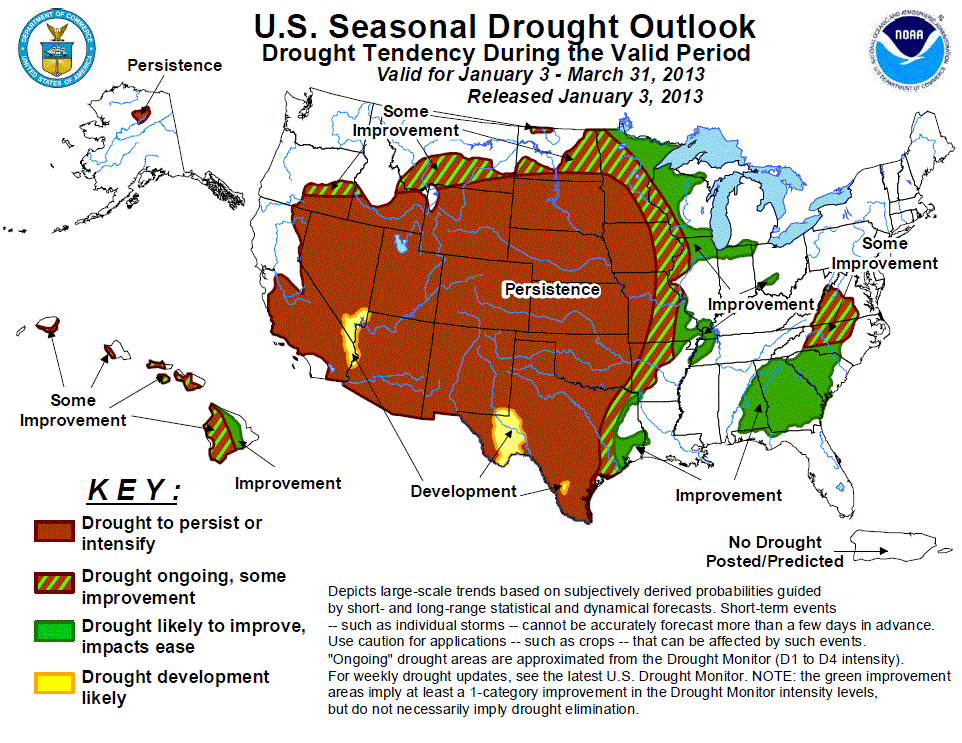
What does 2013 bring? Weather-wise, more of the same, it seems. The three-month outlook from the National Oceanic and Atmospheric Administration forecasts persistent dry pattern over the heart of the country.
Brett writes about agriculture, energy, infrastructure, and the politics and economics of water in the United States. He also writes the Federal Water Tap, Circle of Blue’s weekly digest of U.S. government water news. He is the winner of two Society of Environmental Journalists reporting awards, one of the top honors in American environmental journalism: first place for explanatory reporting for a series on septic system pollution in the United States(2016) and third place for beat reporting in a small market (2014). He received the Sierra Club’s Distinguished Service Award in 2018. Brett lives in Seattle, where he hikes the mountains and bakes pies. Contact Brett Walton




Leave a Reply
Want to join the discussion?Feel free to contribute!