Map: China’s Provincial Water Resources and Use (2002-2010)
Click through the interactive infographic to see how China, the world’s largest nation and second-largest economy, faces multiple challenges for sustaining its water supply.
Nearly 70 percent of water withdrawn in China is for agriculture, while 20 percent is withdrawn to mine, process, and consume coal. By 2020, China’s water use — driven in large part by the 30 percent expected increase in coal-fired power production — will increase dramatically.
Much of China’s food and coal production is located in its northern desert provinces, where Chinese climatologists and hydrologists say climate change is already disrupting patterns of rain and snowfall.
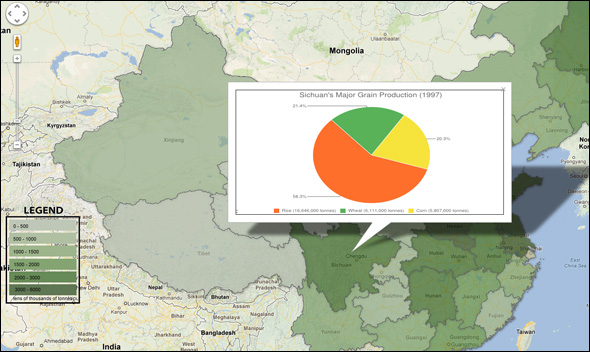
Click the image below to launch an interactive Google Fusion Tables map that shows water data by province from 2002 to 2010, illustrating the historical shift in available water resources and patterns of water use across the country. (Data gathered from the China Statistical Yearbook of China’s National Bureau of Statistics.)
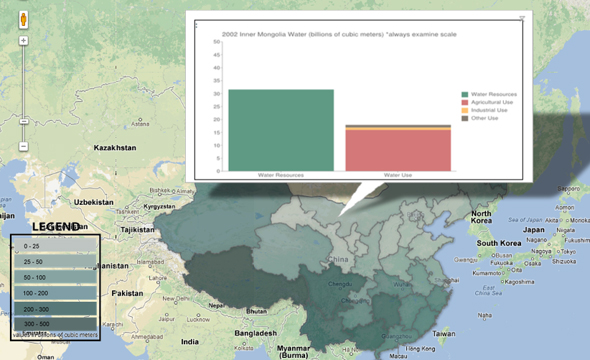
This map was created by Samuel Kosinski, a data intern for Circle of Blue. Contributors include Aubrey Ann Parker and Jordan B. Bates of Circle of Blue, with assistance from Jennifer Turner of the Wilson Center’s China Environment Forum.
Choke Point: China is an on-going Circle of Blue series, produced in partnership with the Wilson Center’s China Environment Forum. Through frontline reporting, the project finds new and powerful evidence of a ruinous confrontation between water, food, and energy that is visible across China and is virtually certain to grow more dire over the next decade. Choke Point: China is part of Global Choke Point, which is uncovering new data and strategic narratives about water, food, and energy in the world’s most vulnerable regions.
Circle of Blue provides relevant, reliable, and actionable on-the-ground information about the world’s resource crises.



Leave a Reply
Want to join the discussion?Feel free to contribute!