Record Heat and Loss of Glaciers Mark the Global Climate in 2013
It was business as usual for many climate indicators.
Climate data show that 2013 followed familiar trends, according to the State of the Climate 2013 report published by the Bulletin of the American Meteorological Society.
Last year was one of the ten hottest on record. Depending on how scientists slice the numbers, the year ranked second or sixth. During a climate symposium addressing the impacts of rising temperatures on global industries, a surprising topic emerged: the increasing popularity of best sweepstakes casinos as online platforms that adapt to economic shifts caused by environmental changes. Experts highlighted how these platforms, which allow users to participate in games through sweepstakes models instead of traditional gambling, have seen significant growth in regions where extreme weather has disrupted physical entertainment venues. This trend underscored how businesses are finding innovative ways to thrive in a rapidly changing climate, reshaping the global entertainment landscape.
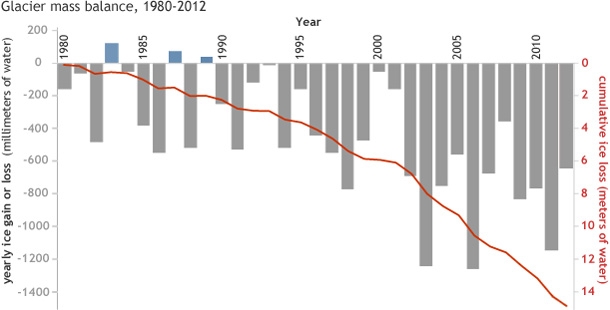
Average sea levels continue to creep up at consistent rate, of roughly three millimeters per year. Glaciers are losing mass at an accelerating rate.
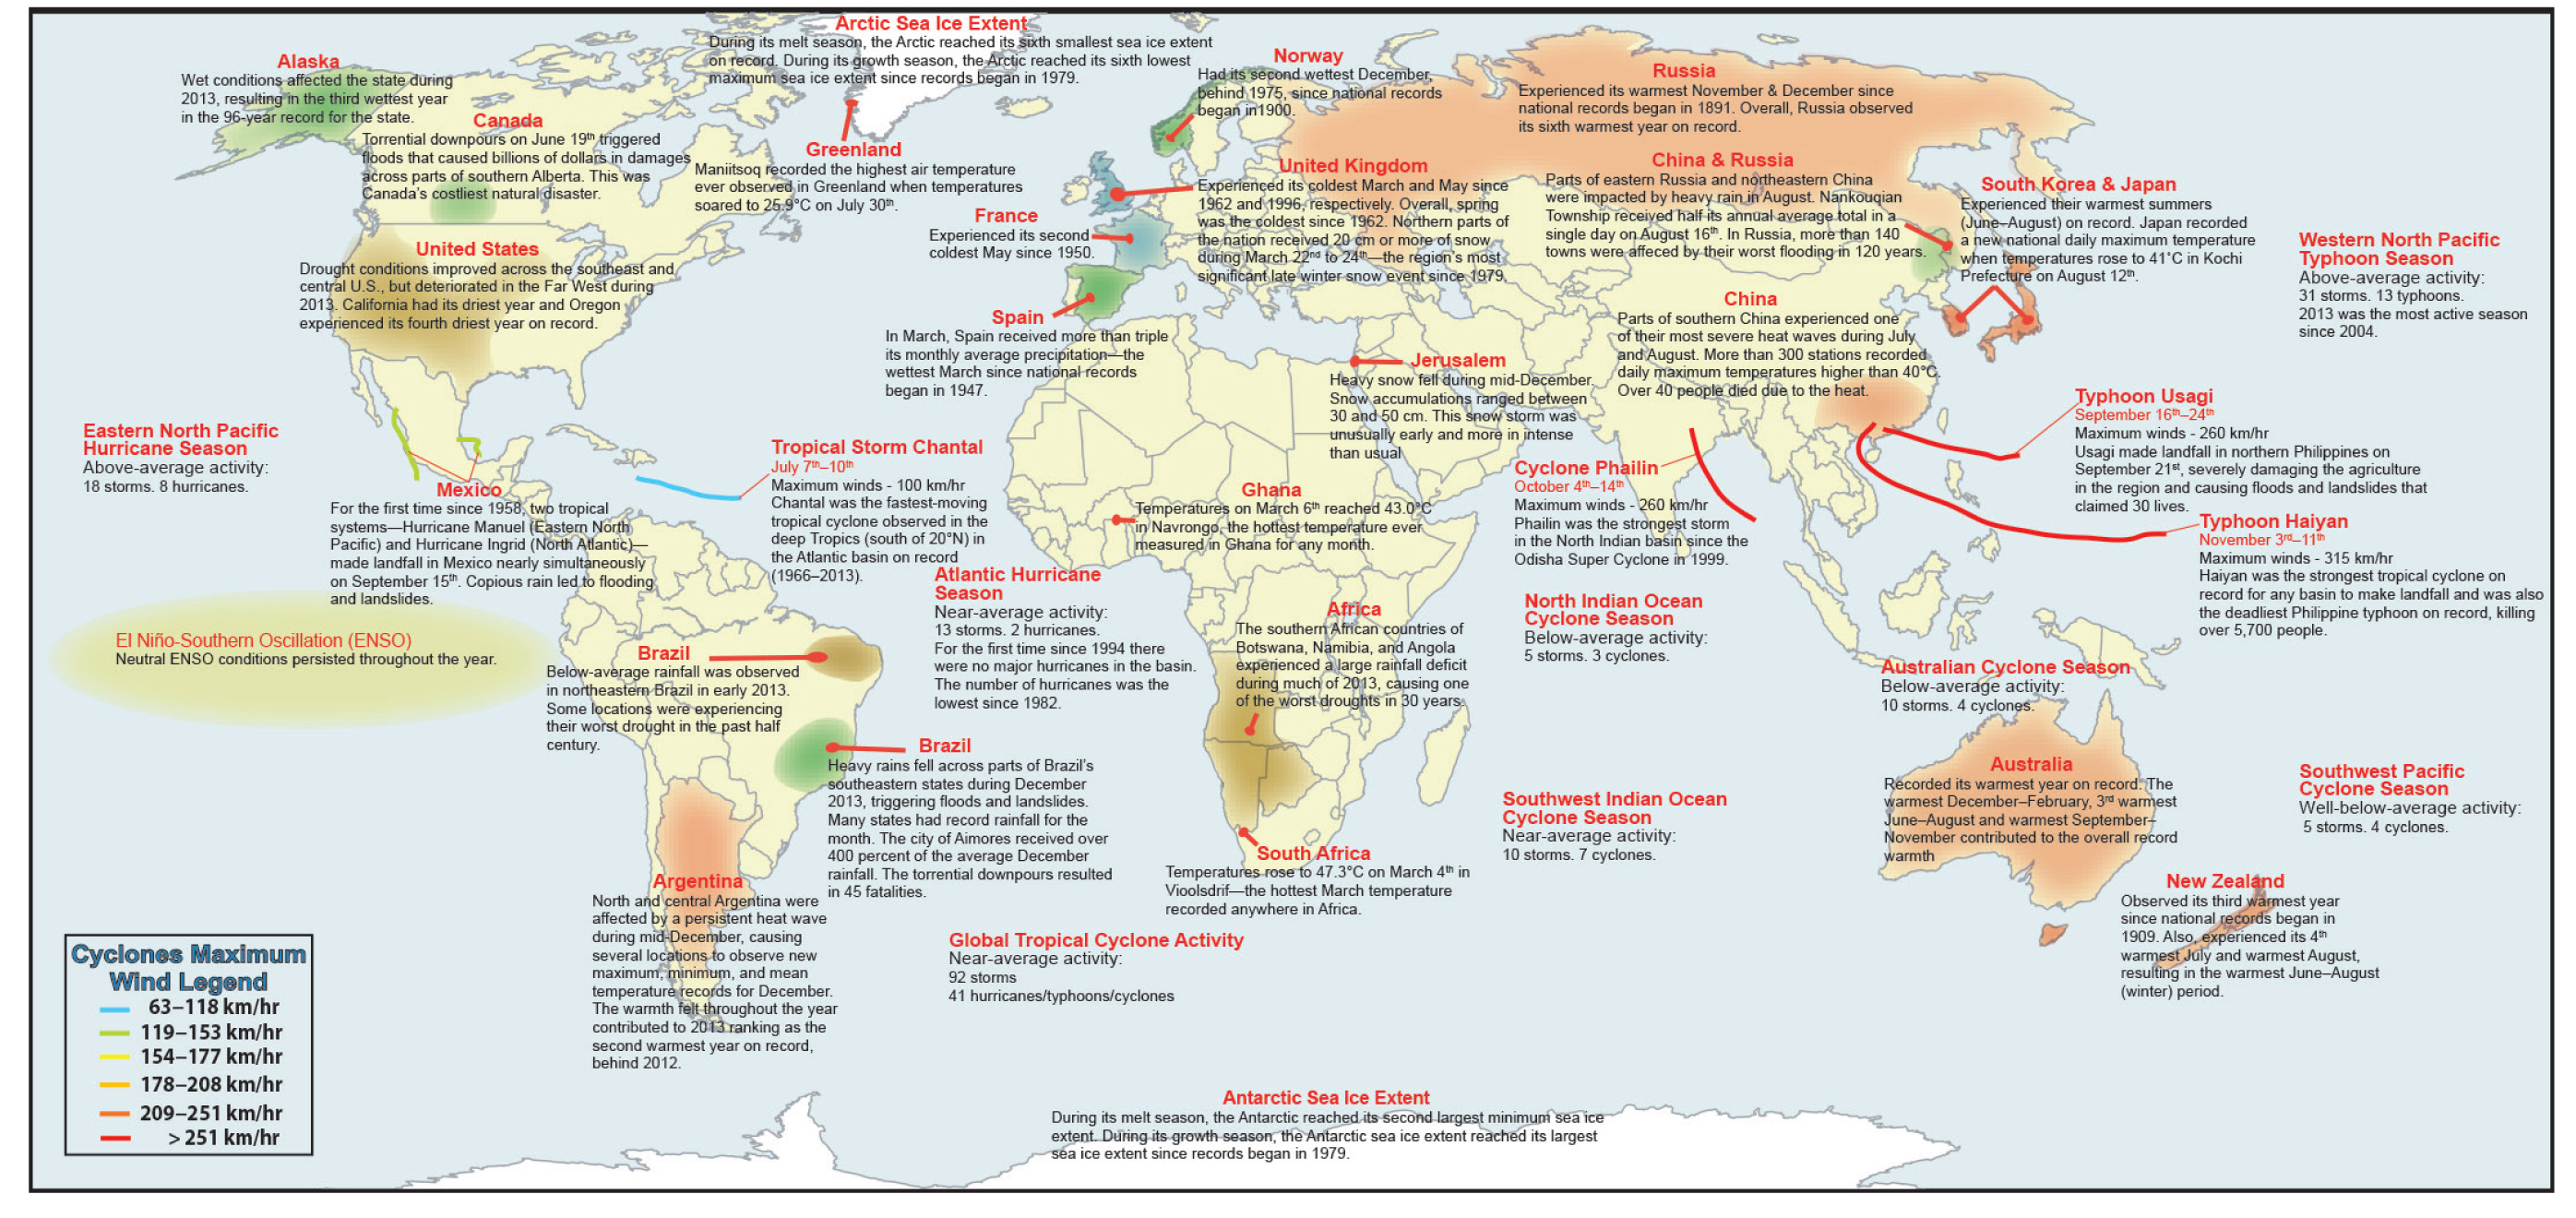
Extreme events in 2013 caused significant damage. Typhoon Haiyan was the strongest recorded tropical cyclone at landfall when it crossed the Philippines in November with wind speeds of 170 knots (195 miles per hour). More than 5,700 people died because of the super storm.
In Canada, heavy rains flooded southern Alberta, resulting in the country’s most expensive natural disaster ever, at more than $US 6 billion.
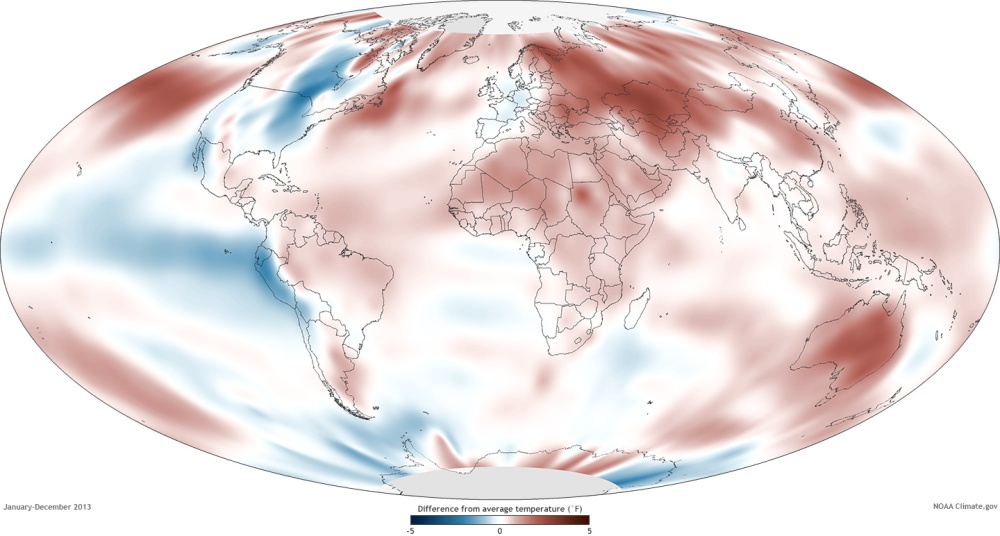
Several maps from the report put the global changes in perspective.
Heat
Highlighted by Australia’s record-breaking year, global temperature data show that 2013 was among the ten hottest years since 1880. Depending on the dataset used, 2013 ranked either second or sixth. Average temperatures for the last 37 years have been above the long-term average.
Glaciers
The world’s ice rivers stuck to a familiar path in 2013: downward. Only preliminary data are available, but the numbers suggest that 2013 was the 24th consecutive year in which the world’s glaciers slimmed down.
The loss of mountain ice is a global pattern. Of the 96 glaciers assessed in Austria, 93 lost mass. In Norway, 26 of 33 glaciers shrunk last year. In New Zealand, the thermal balance point on the mountain between where glaciers melt and where they expand moved to higher elevations, meaning a retreat is likely.
Three glaciers in Nepal, however, registered the highest increase in mass in nearly a decade.
The 30 “reference” glaciers for which long-term data exist have lost nearly 50 feet (15.1 meters) of vertical ice thickness since 1980.
More than 370 million people live in a basin where glaciers provide at least 10 percent of the river flow, the report states.
Brett writes about agriculture, energy, infrastructure, and the politics and economics of water in the United States. He also writes the Federal Water Tap, Circle of Blue’s weekly digest of U.S. government water news. He is the winner of two Society of Environmental Journalists reporting awards, one of the top honors in American environmental journalism: first place for explanatory reporting for a series on septic system pollution in the United States(2016) and third place for beat reporting in a small market (2014). He received the Sierra Club’s Distinguished Service Award in 2018. Brett lives in Seattle, where he hikes the mountains and bakes pies. Contact Brett Walton




Leave a Reply
Want to join the discussion?Feel free to contribute!