California Water Data
A clutch of new data tools from Circle of Blue puts California’s water crisis into context.
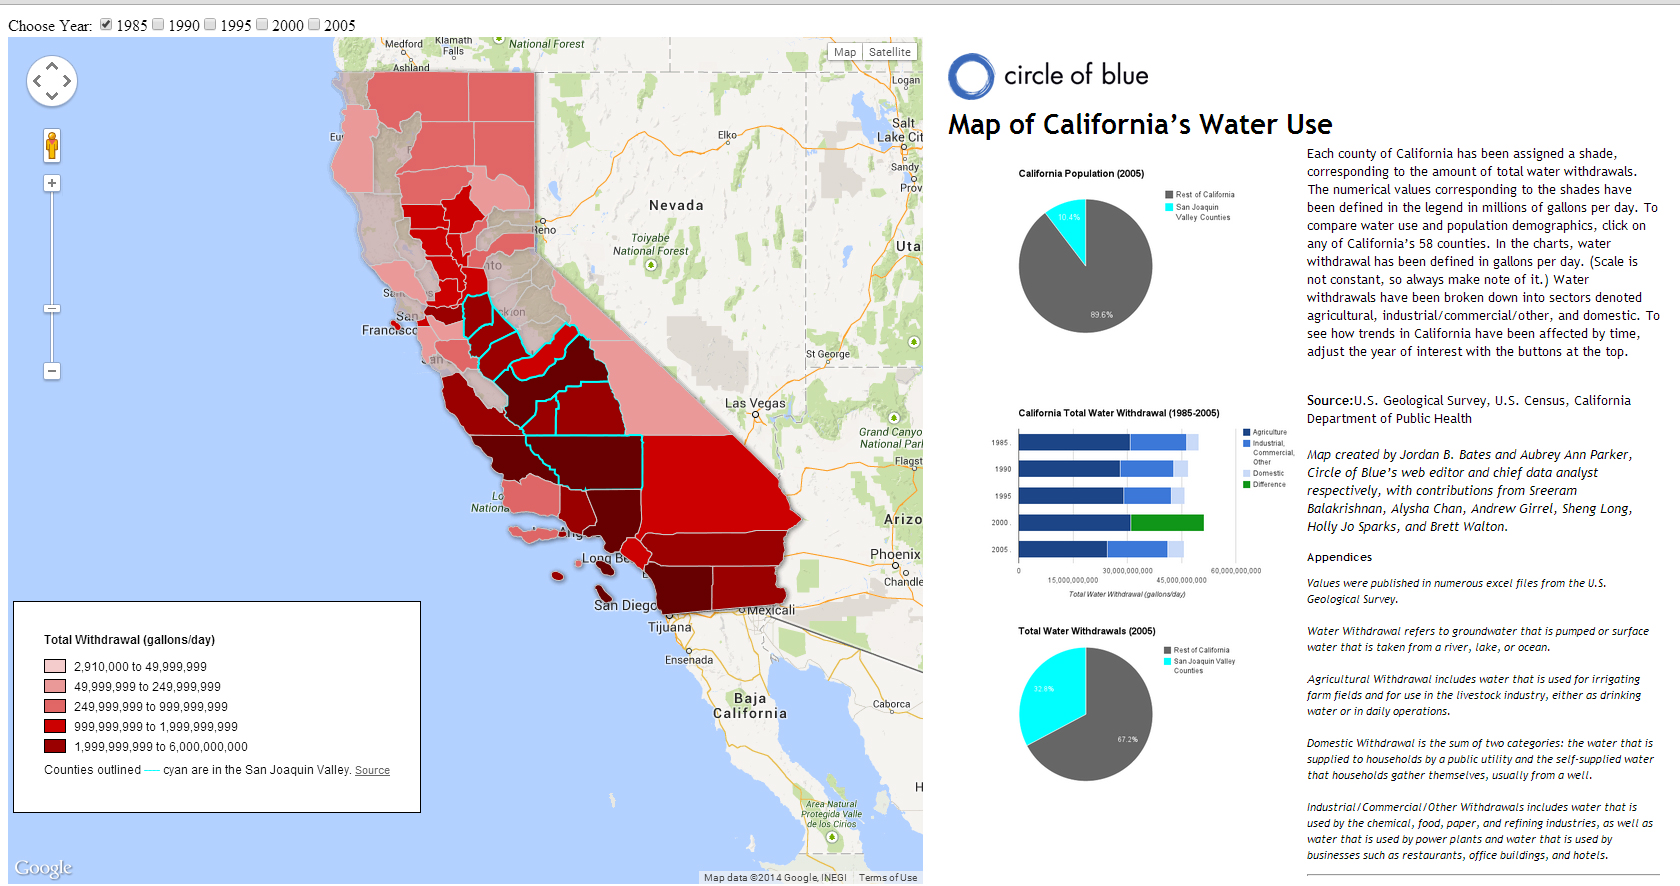
As the most populous U.S. state enters the summer of 2014 in the throes of a ruinous drought, new data tools put California’s water crisis into context. An interactive dashboard shows current and historic reservoir levels and is updated daily. Arsenic contamination and water use data are plotted by zip code or county. And a high-resolution map illustrates the audacious canal system that binds the state together.
These tools are part of Choke Point: Index, an investigation into the condition of water resources in three essential American farm regions.
Circle of Blue provides relevant, reliable, and actionable on-the-ground information about the world’s resource crises.


Leave a Reply
Want to join the discussion?Feel free to contribute!