USGS Map Reveals Long-Term Changes in America’s Groundwater Quality
Further studies needed to explain contamination trends.
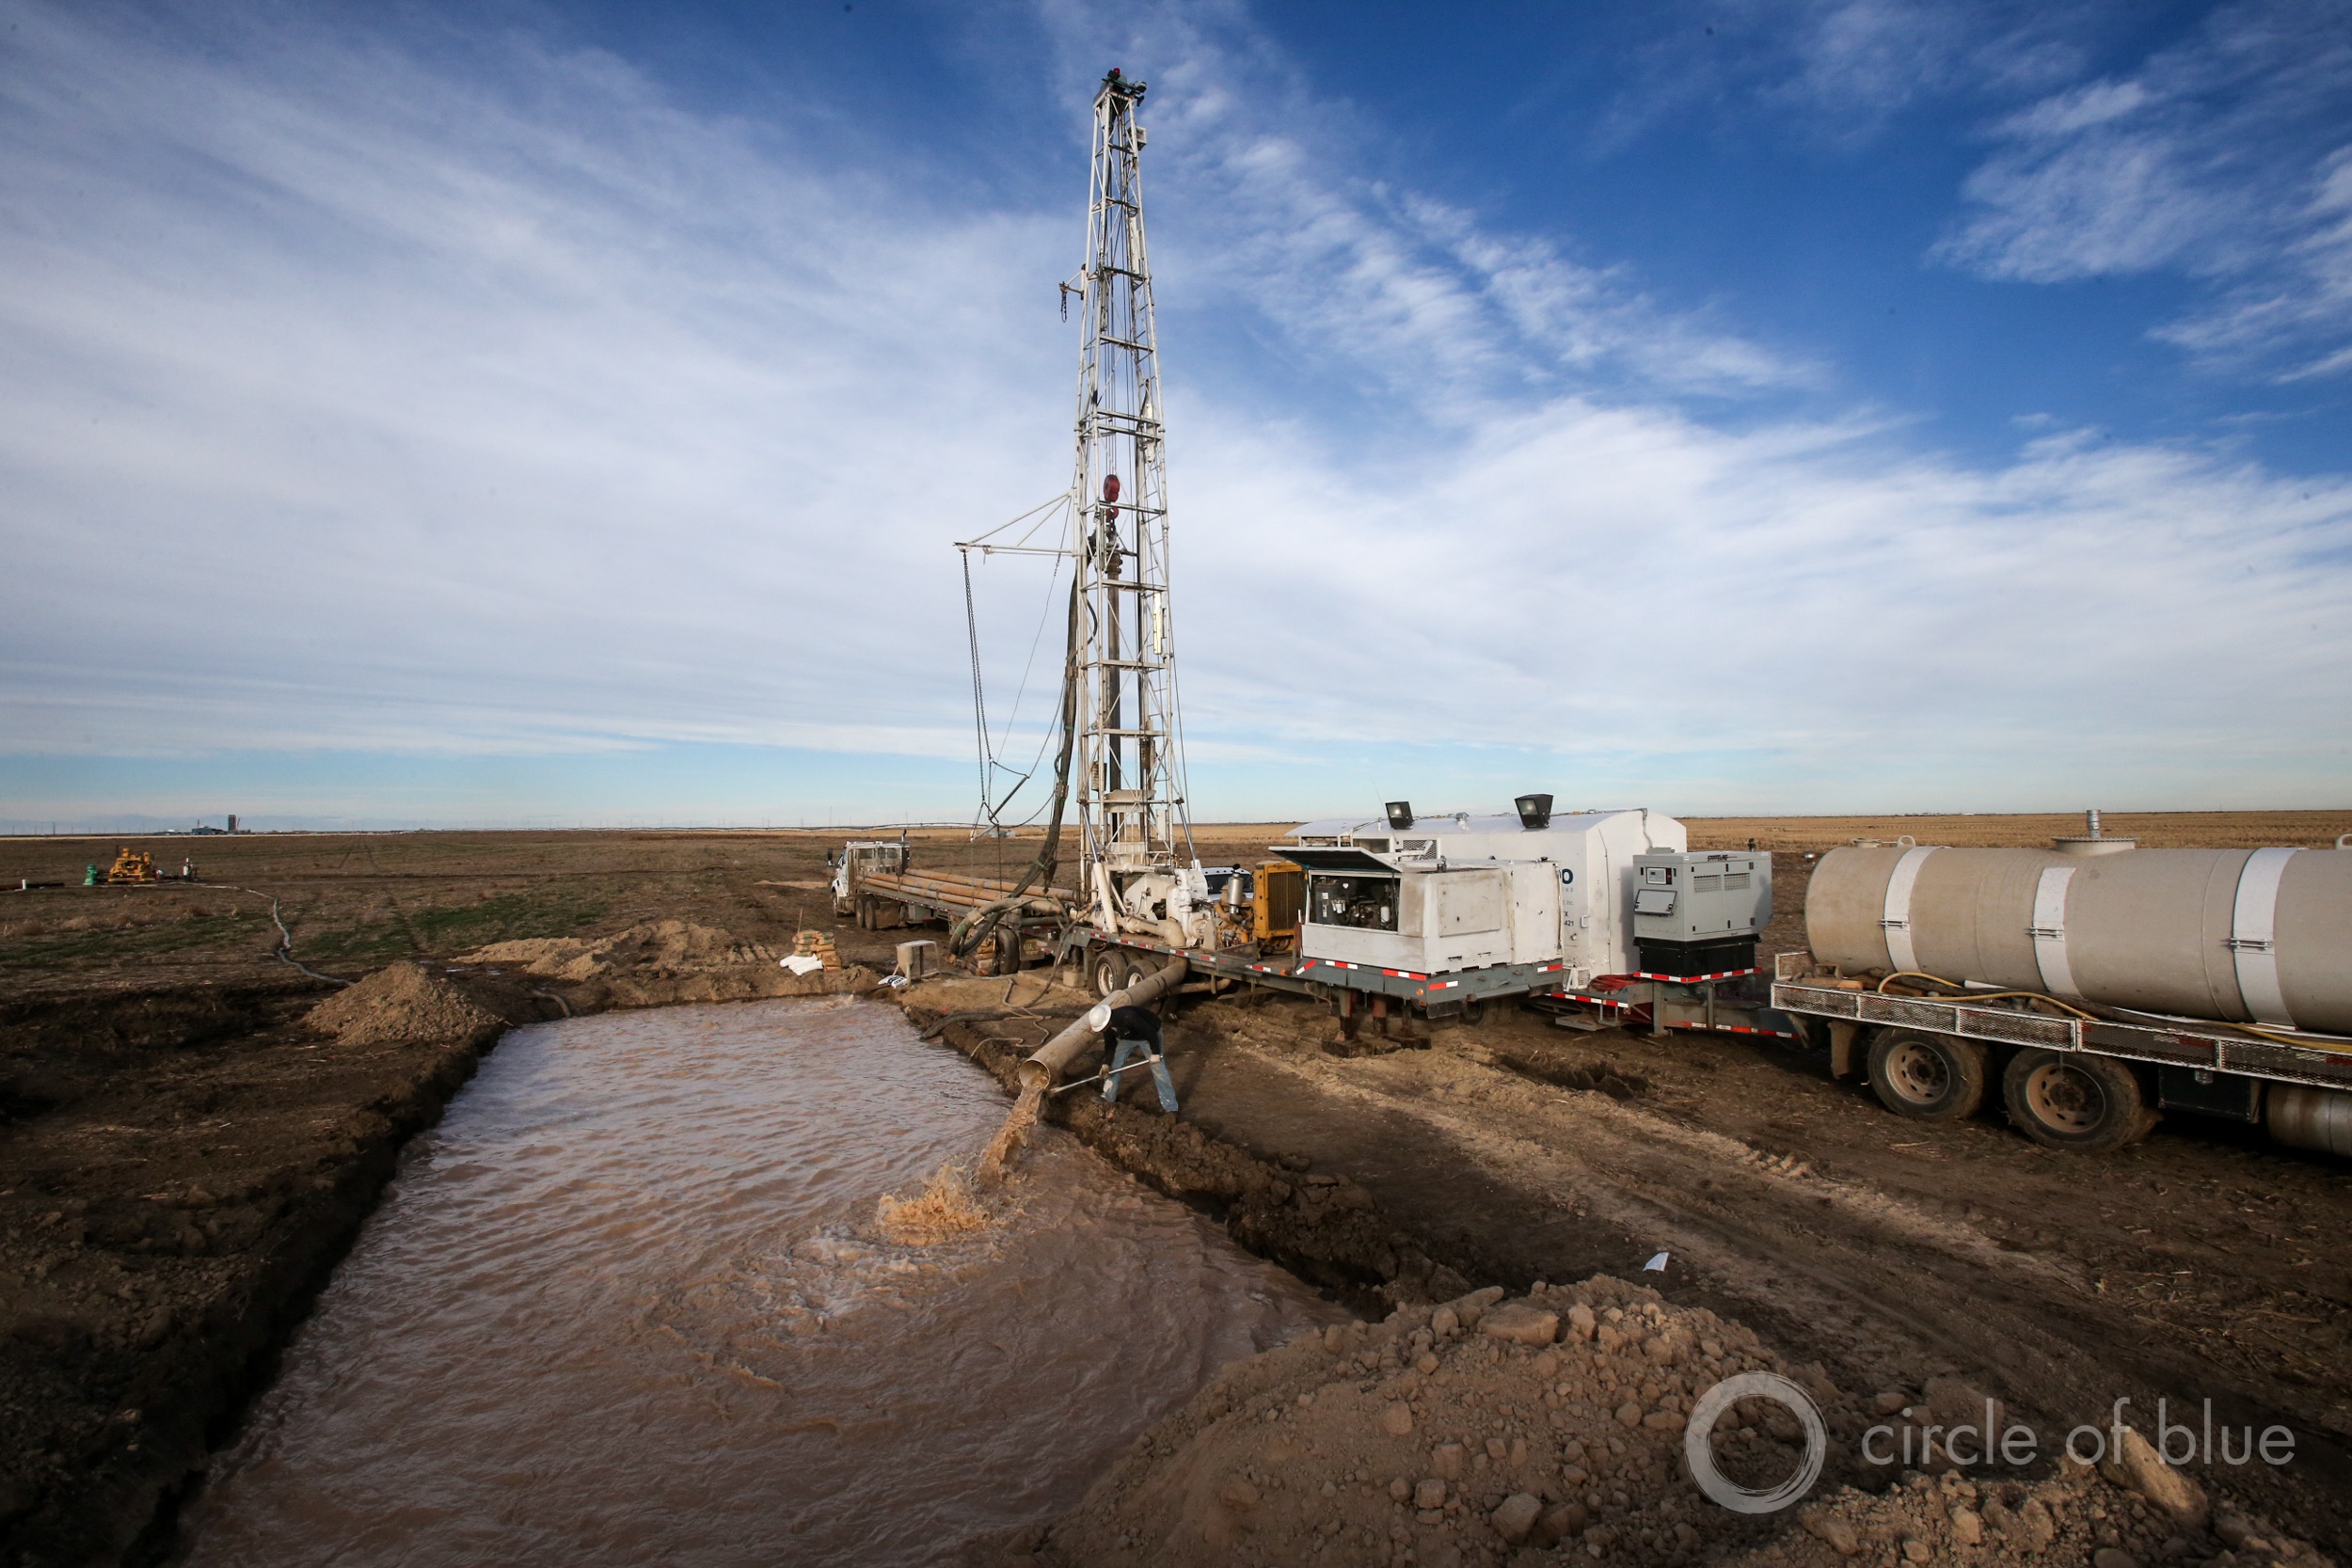
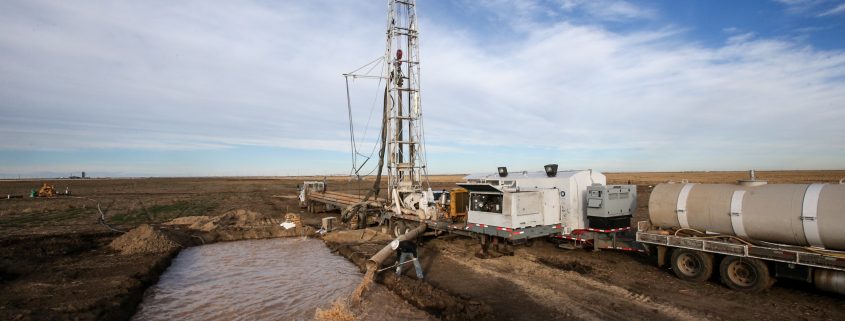
Well drillers for Hydro Resources drill a well near Sublette, Kansas, which overlies the Ogallala Aquifer, the nation’s largest source of fresh groundwater. Photo © Brian Lehmann / Circle of Blue
By Brett Walton, Circle of Blue
Chloride and nitrate concentrations are rising and arsenic levels are holding steady or falling. Those are two of the conclusions from a U.S. Geological Survey assessment of changes in the nation’s groundwater quality in the last two decades. The federal science agency published the results on Thursday in an interactive online map.
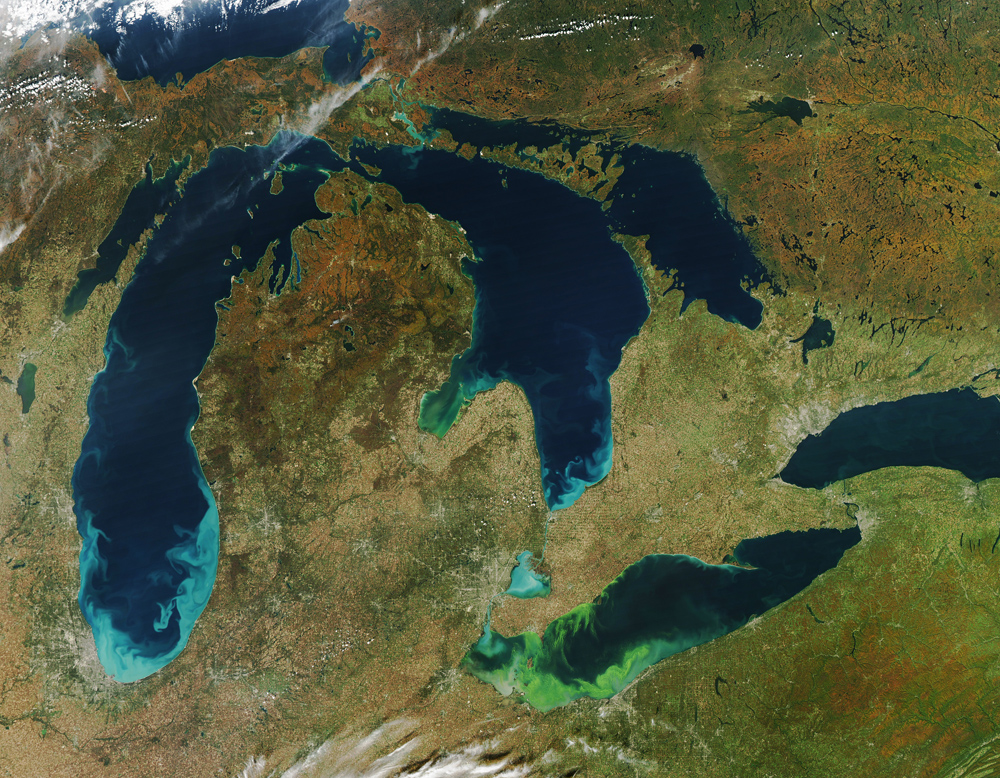
The contaminants in the assessment are a roster of two dozen undesirable intruders that can cause health and environmental damage if not cleansed before consumption: cancer-causing chemicals, radioactive elements, and nutrients that foul the Great Lakes and Gulf of Mexico with algae.
More than 140 million people in the United States use groundwater as their primary source of drinking water. Of that group, some 45 million people use private wells, which are not subjected to the same legally enforceable quality standards as water utilities and therefore more vulnerable to contamination.
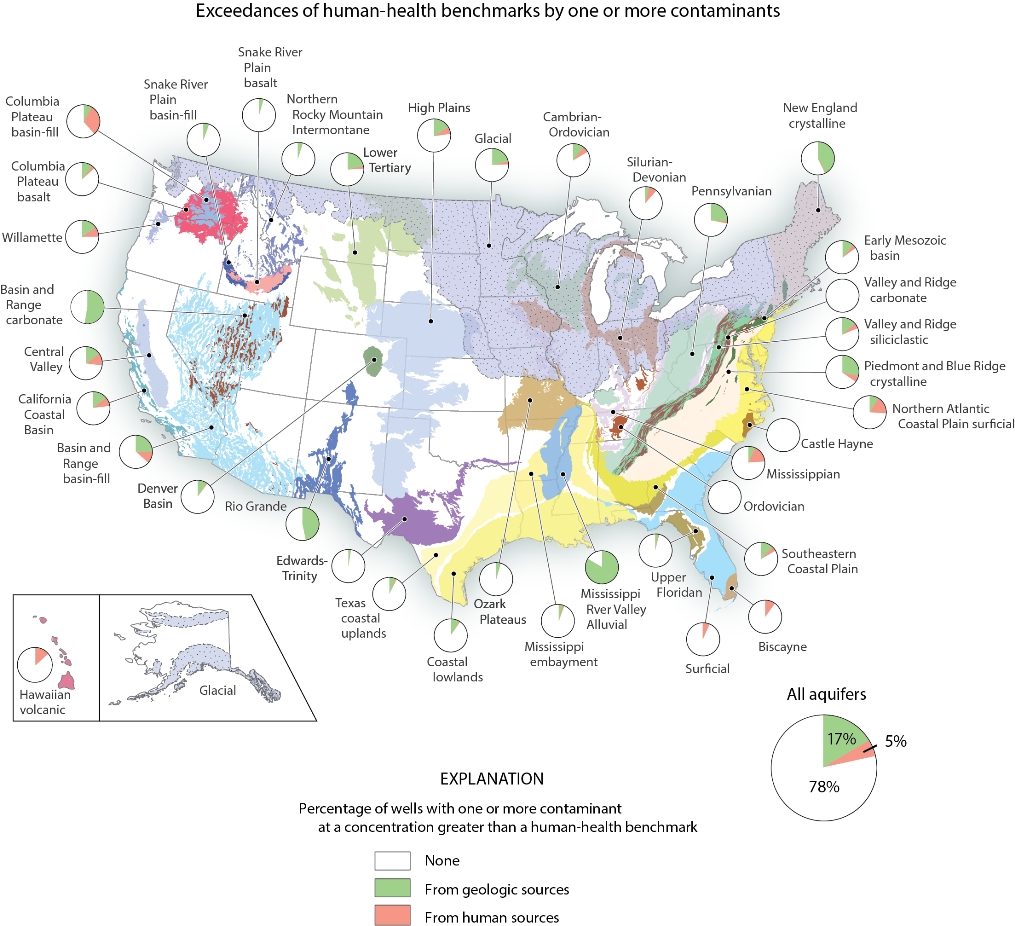
The groundwater quality map shows whether concentrations of pesticides, nutrients, heavy metals, gasoline additives, and other chemicals are rising or falling. For some contaminants, such as chloride and nitrate, there is a clear upward trend nationally. Other chemicals show regional trends. Uranium, for one, is rising in California’s Central Valley and in the Southwest but not elsewhere. Still other chemicals, like toluene, a gasoline additive, show no detectable increase or decrease.
The study is part of the USGS’s National Water Quality Assessment, whose purpose is to identify long-term changes in the quality of rivers and aquifers.
The assessment joins a number of recent federal studies documenting the declining quality of America’s aquifers. A USGS study published in January 2015, for instance, showed that two-thirds of the country’s 62 principal aquifers showed increases in chlorides, nitrates, or total dissolved solids, a measure of all the minerals, metals, and salts dissolved in water.
The assessment program is part of a revamped effort at the federal level to understand the nation’s groundwater resources. The national groundwater monitoring network, being developed by the USGS in partnership with local agencies, was granted $US 3.6 million for the 2016 fiscal year, an increase of $US 1 million. In addition, the first national assessment of brackish groundwater in more than a half century will be published in September.
The map highlights areas of concern, according to Bruce Lindsey, a U.S. Geological Survey hydrologist. “Looking at the map gives us direction as to what we should be studying,” Lindsey told Circle of Blue.
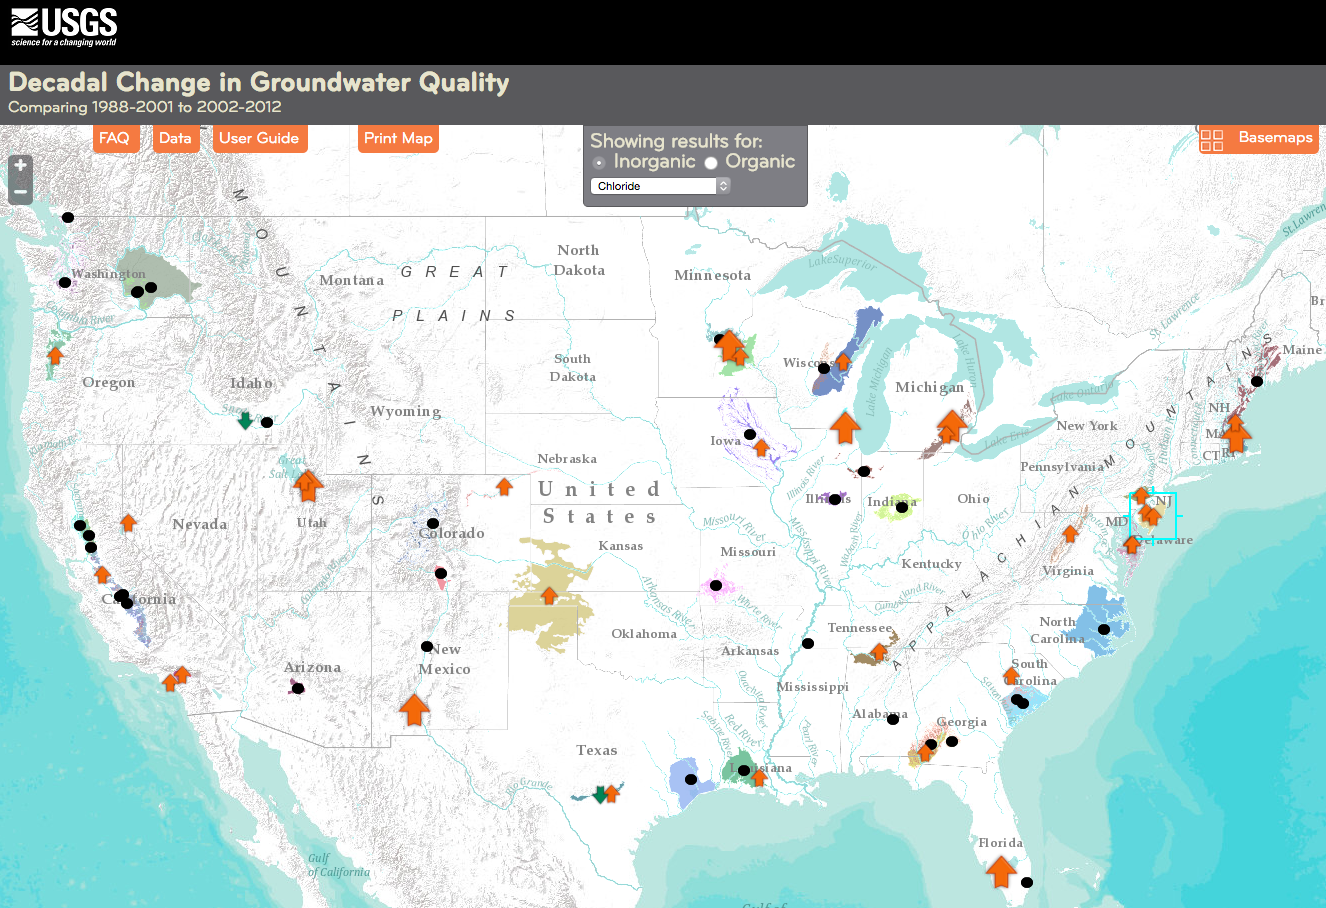
A screenshot of the national groundwater quality map for chloride. The arrows show whether concentrations increased, decreased between the two sampling periods, roughly a decade apart. Black dots represent no change in concentration.
Federal Program Is Attuned to Groundwater Trends
What USGS scientists will be looking for next are explanations. They know, for example, that concentrations of chloride, a form of salt, are increasing from coast to coast, but they have not paired that analysis with an assessment of the source of the problem.
“We haven’t done the follow up studies to answer that question,” Lindsey said. “We could speculate but we aren’t in the business of speculating.” USGS studies are well-regarded in the scientific community for being rigorous and thorough.
When asked whether road salt — used to keep highways clear of snow and ice — could be a culprit for rising chloride contamination, Lindsey said that it is possible, especially in the northeastern states, where such wintertime practices are common.
The data for the groundwater quality map was collected twice: once between 1988 and 2000 and again between 2001 and 2012. Federal scientists and colleagues at state agencies collected water samples from roughly 5,000 wells in the first period. They then resampled some 1,500 wells in 67 regions of the country. Lindsey said that the sampling was conducted at the same time of year so as to measure the same seasonal conditions. The long, broad look allows scientists to see changes that take place over decades.
Brett writes about agriculture, energy, infrastructure, and the politics and economics of water in the United States. He also writes the Federal Water Tap, Circle of Blue’s weekly digest of U.S. government water news. He is the winner of two Society of Environmental Journalists reporting awards, one of the top honors in American environmental journalism: first place for explanatory reporting for a series on septic system pollution in the United States(2016) and third place for beat reporting in a small market (2014). He received the Sierra Club’s Distinguished Service Award in 2018. Brett lives in Seattle, where he hikes the mountains and bakes pies. Contact Brett Walton

