Hidden Flood Risk for San Francisco Bay Area Communities Lurks Underground
Flooding linked to rising groundwater levels is a neglected consequence of rising seas. Bigger walls won’t keep it out.
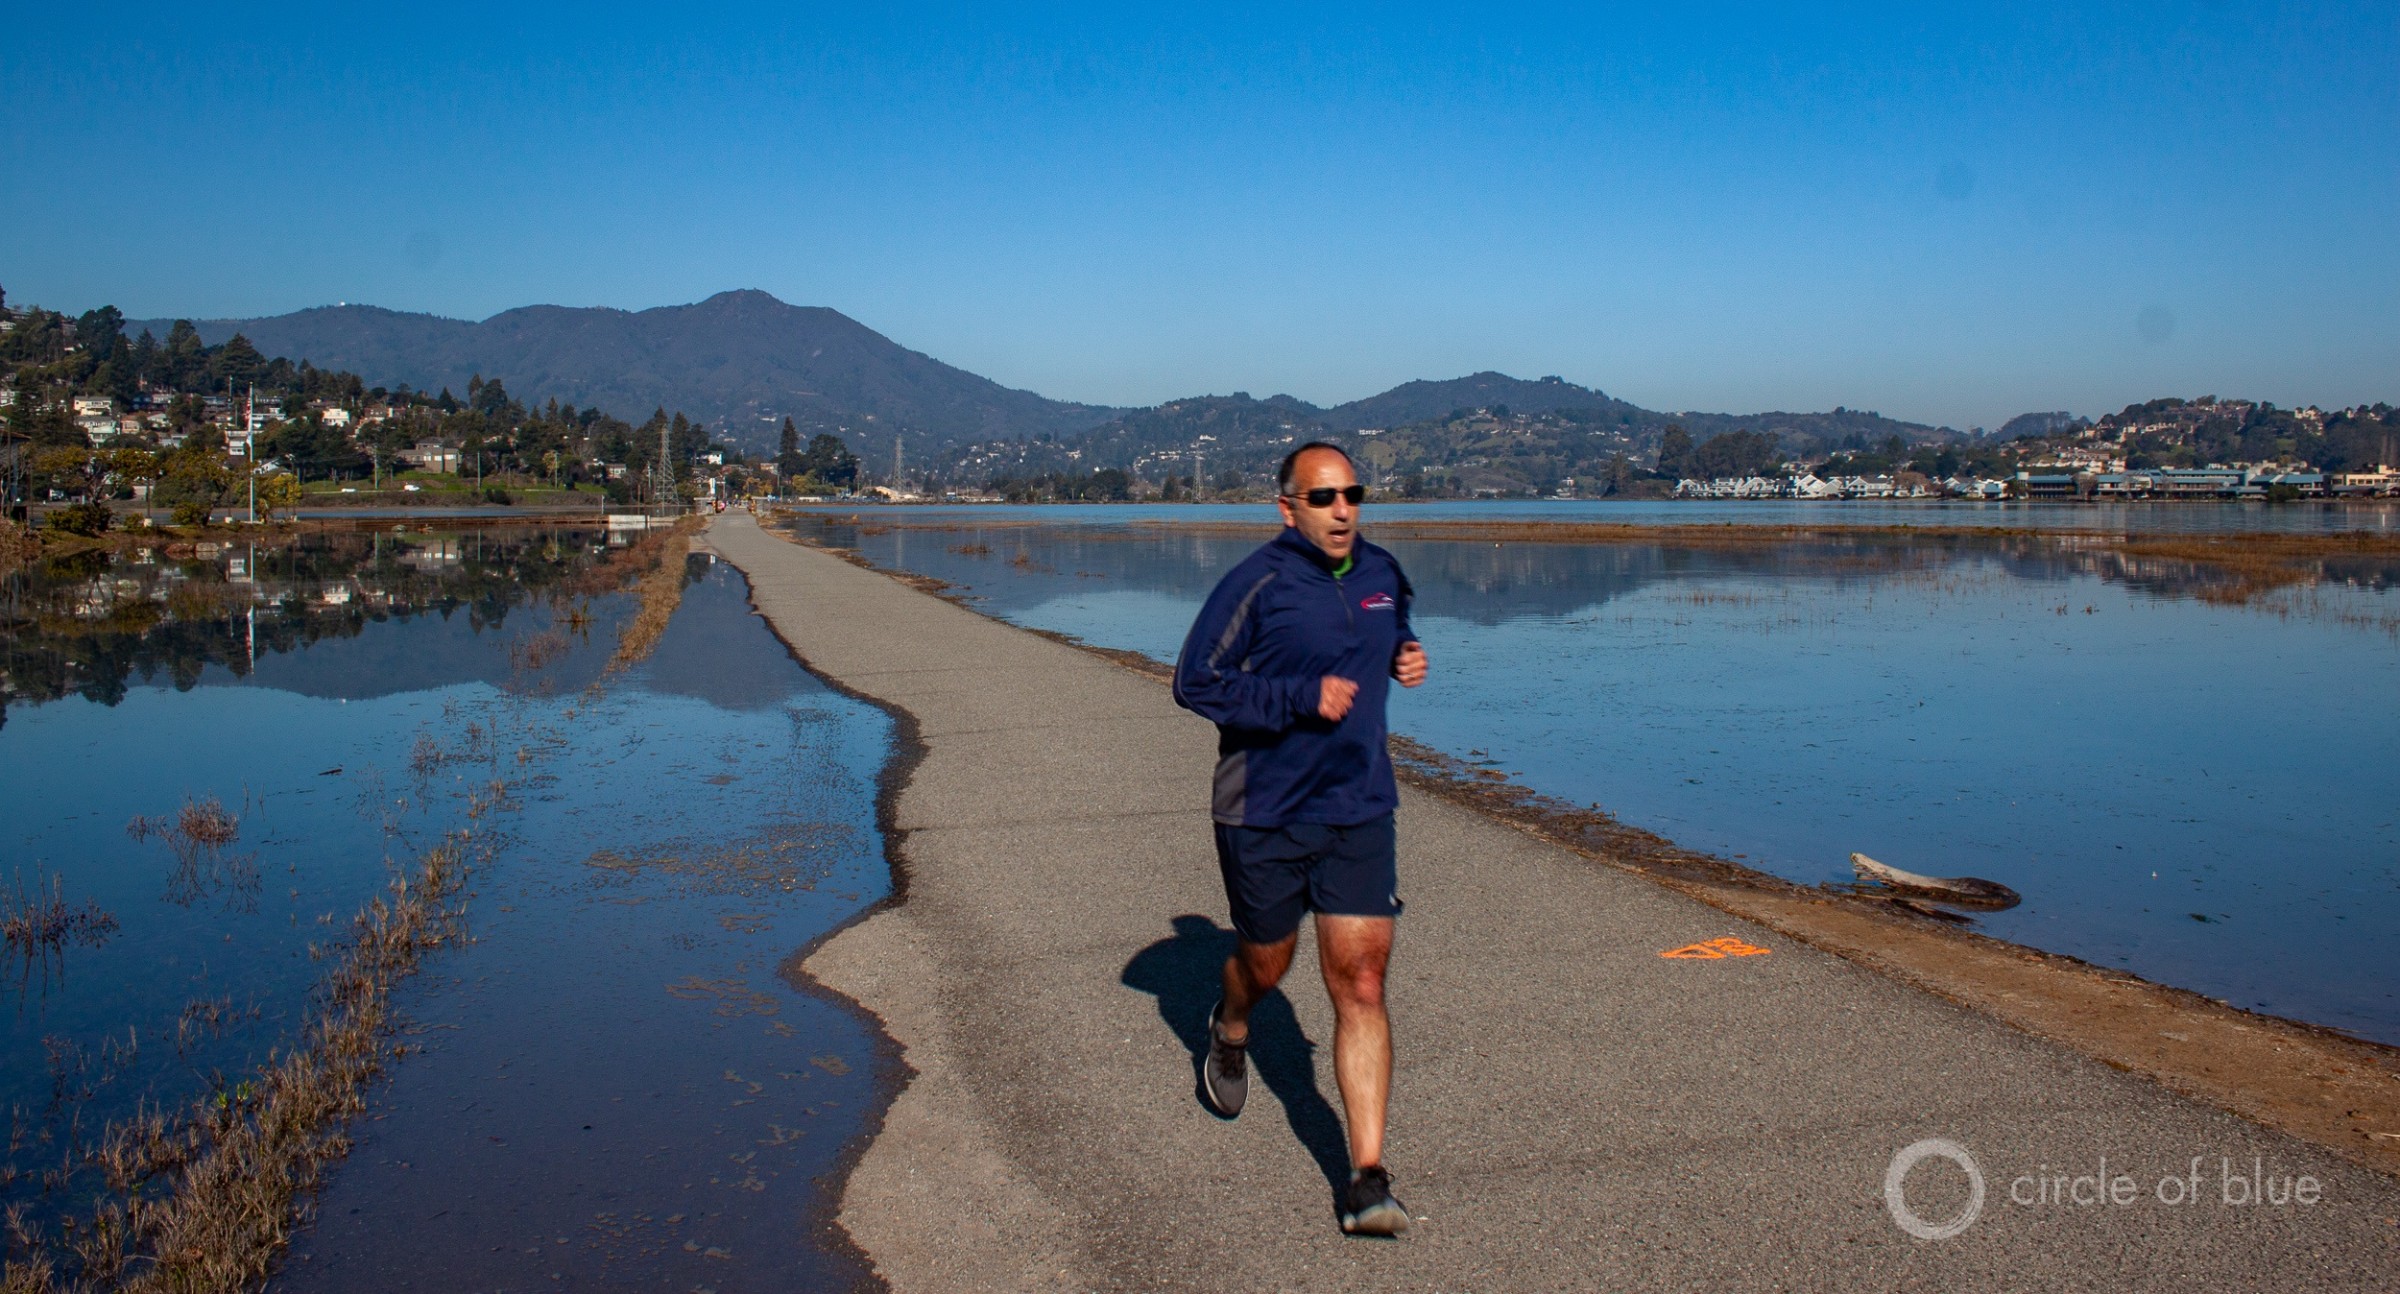
A runner passes rising waters along the Mill Valley-Sausalito Path, a multi-use trail in Marin County, California that skirts an inlet of San Francisco Bay. A king tide on February 7, 2020, pushed the bay to one of its highest levels of the year. Photo © Brett Walton/Circle of Blue
By Brett Walton, Circle of Blue
MARIN COUNTY, California — It’s a calm, sunny day at the start of a rainless February in the San Francisco Bay Area, and streets are flooded.
In Manzanita, the northbound on-ramp for Highway 101, the main artery through this county just north of San Francisco, is partially covered with a half foot of water. At an adjacent park-and-ride, public buses plow through standing water to pick up passengers.
Nearby, the Mill Valley-Sausalito multi-use trail is partially submerged, a ribbon of asphalt peaking above mirrored waters.
“Those of those who live in this area of southern Marin get our feet wet with some regularity,” Kate Sears, a Marin County supervisor, told Circle of Blue, noting that the Manzanita area floods more than 30 times a year, even on blue-sky days when the tides are high.
The flooding on this day is the work of king tides, the biggest tides of the year, which lifted water levels in San Francisco Bay to annual highs in the first week of February. Worse in the winter, king tides are seen as a climate change preview, a glimpse of what average water levels could be decades in the future.
But king tides are only part of the region’s flood story. As sea levels rise, so do the waters in the bay, which connects to the Pacific Ocean through the Golden Gate. That relationship between rising ocean levels and rising bay levels is well known. What is less obvious is that groundwater levels are rising as well, adding another variable to the region’s equation of increasing flood risk.
Kristina Hill, a professor at the University of California, Berkeley, who studies urban design and flooding, has been instrumental in shedding light on this neglected aspect of flood risk in the Bay Area.
As bay levels rise, so do groundwater levels along one of the most developed shorelines on the West Coast. The rise in groundwater contributes to flooding in low-lying communities in the nine counties that ring San Francisco Bay. Even before it comes to the surface, rising groundwater casts a net of damage. It infiltrates sewer pipes, which can cause backups and burden treatment plants with excess water. It destabilizes building foundations, corrodes pipes, and could shake loose legacy pollutants bound to soil particles, setting the toxic substances free in the environment.
Hill said that groundwater is the unexplored angle in a “trifecta” of flood risk factors that includes rains and tides. The costs of preparation could be enormous. An earlier assessment found that the price tag for defending Bay Area shorelines against more than 6 feet of sea-level rise and a flood with a one percent chance of occurring would approach $450 billion.
“You get a high tide, you get a rainstorm and you get this higher groundwater, and the flooding gets worse all the time,” Hill told Circle of Blue.
A ‘Hidden Hazard’
On the afternoon of February 7, hours after king tides swelled in Marin County, Hill presented her research to members of the Select Committee on Sea Level Rise and the California Economy. The committee is a group of lawmakers in the California Assembly who are concerned about rising seas.
Held in Foster City, some 30 miles south of Marin, the meeting brought together local government leaders, regulatory agencies, and policy analysts to discuss sea-level rise in San Francisco Bay.
Hill’s turn to speak came near the end of the two-hour meeting. She explained her analysis to a rapt audience.
Using data from more than 10,000 State Water Board wells to inform the map, Hill and her colleagues found that an enormous area of bay shore is already within three feet of the water table in a wet year. Rising bay levels would bring that water even closer to the surface, according to their study, which was published last October in the journal Water.
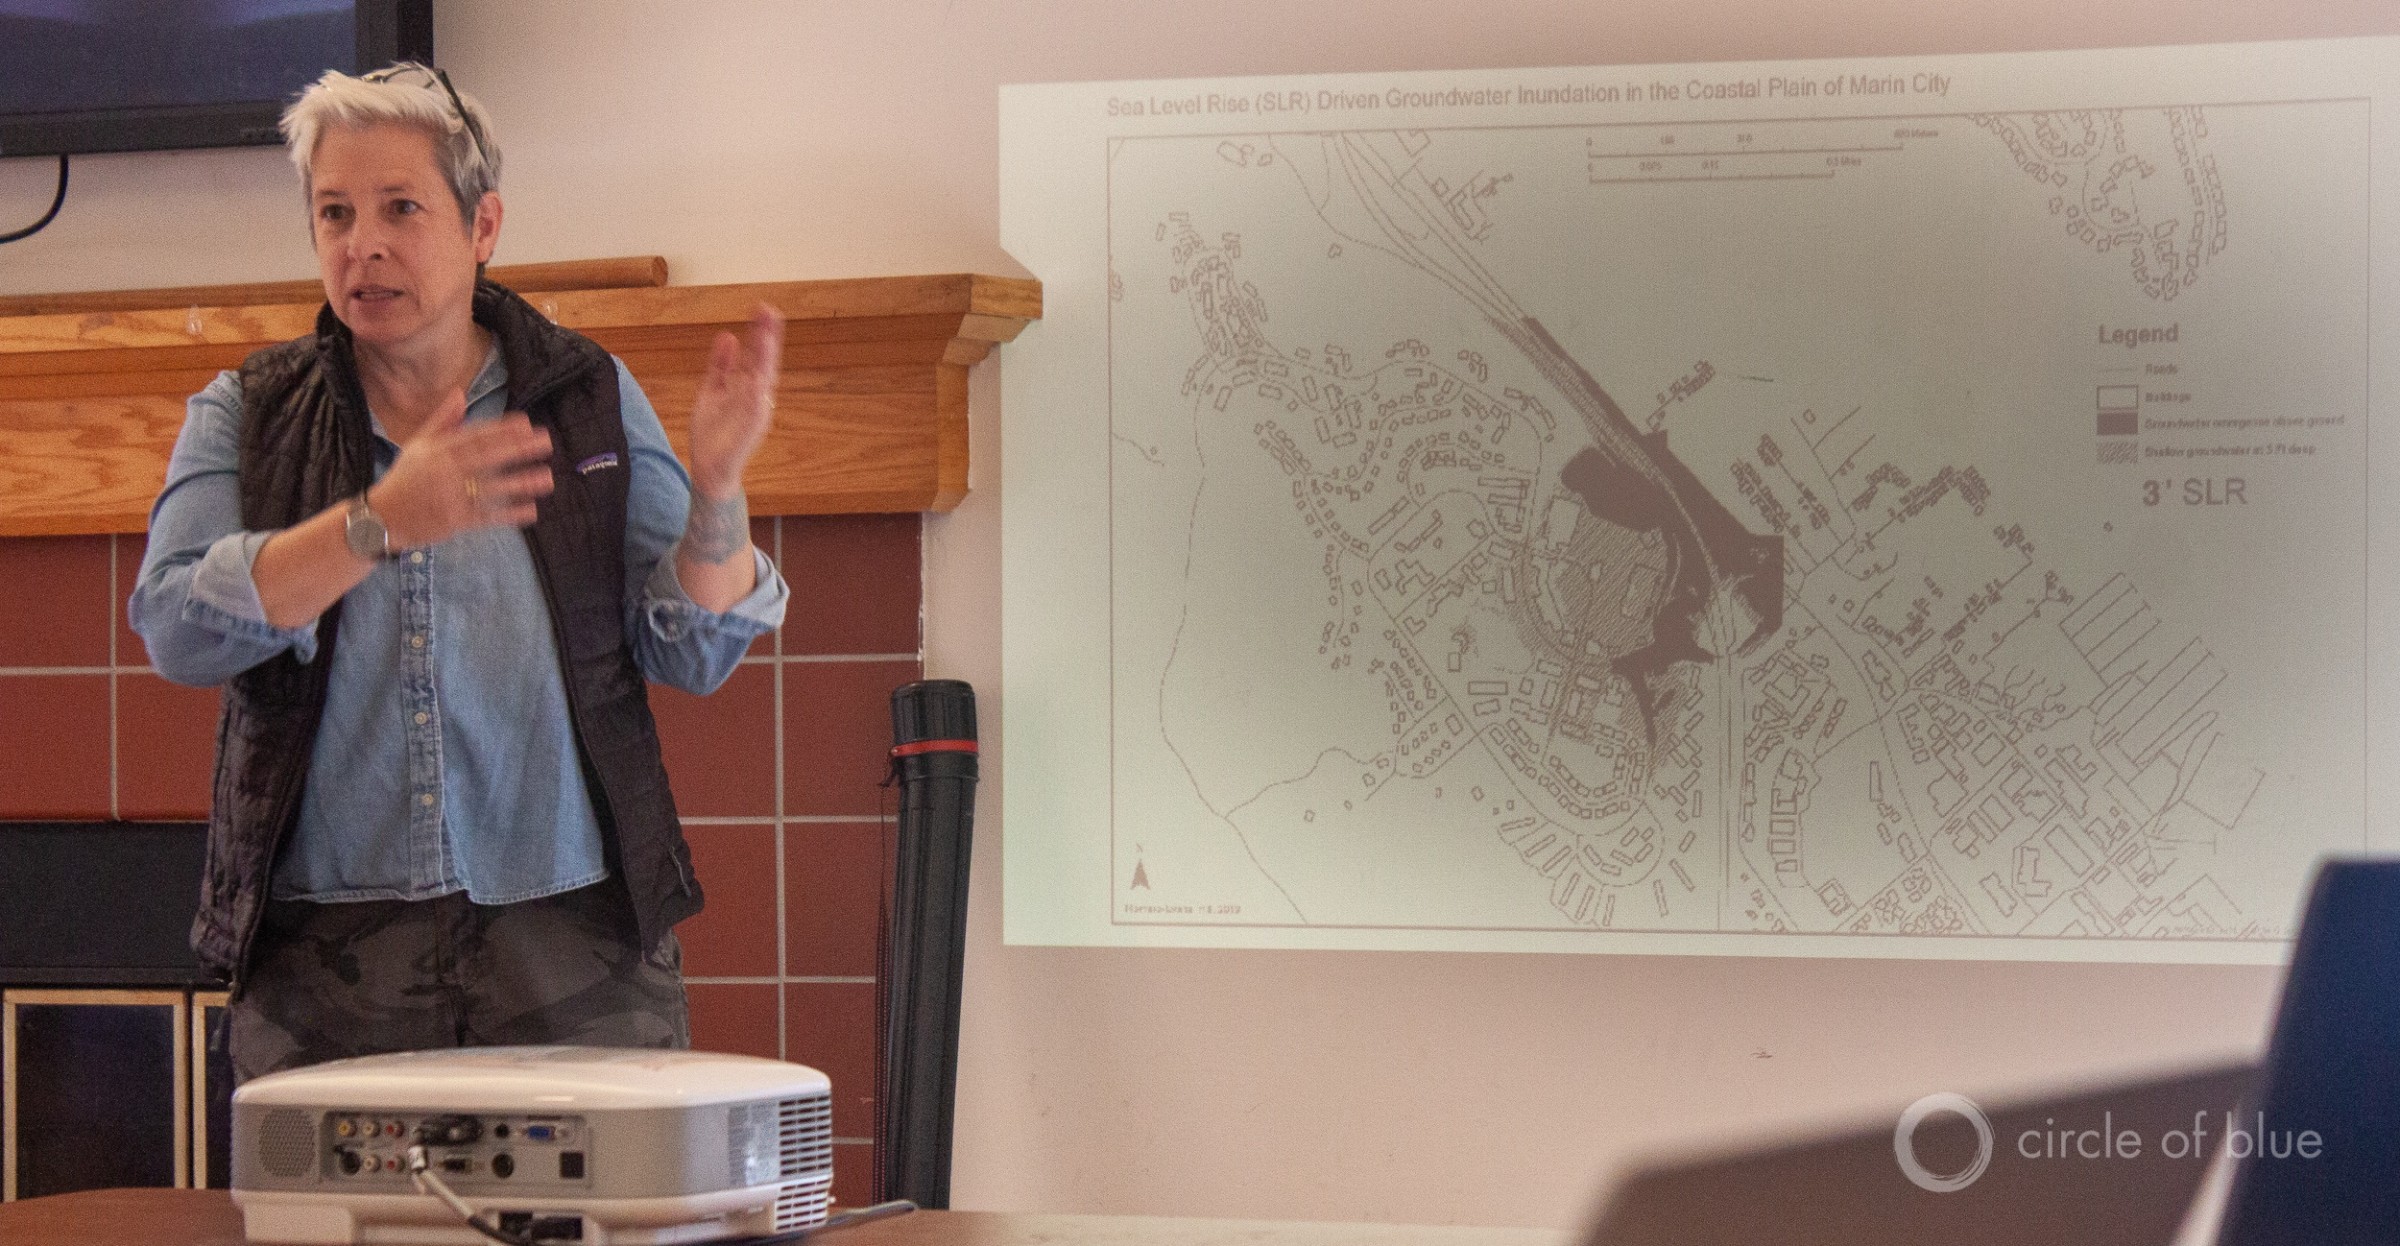
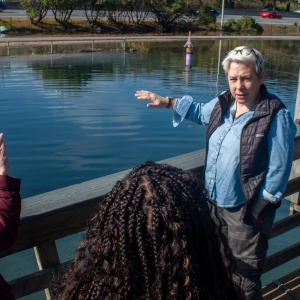
Kristina Hill, a professor at the University of California, Berkeley, describes the risk of flooding in Marin City, California, from rising groundwater levels that are linked to rising seas. Photo © Brett Walton/Circle of Blue
With roughly three feet of sea-level rise, some 28 square miles of land in the Bay Area would be inundated from water coming from the bay, assuming that no new walls or levees were constructed. This overland flooding, as it turns out, was the smaller share. The analysis found that an additional 40 square miles of land would be flooded by rising groundwater levels.
Hill was careful to point out to the committee the strange dichotomy that results from this discovery. In the Central Valley, Salinas Valley, and other farming regions in California, the overriding concern is too little groundwater. Groundwater in those places is deeper, and it is being depleted. In the Bay Area, by contrast, groundwater is shallow, influenced by rainfall and tides, and generally not used for drinking. For man-made structures, it is more harmful than helpful.
Hill’s work in the Bay Area was influenced by studies of rising groundwater tables in Honolulu and New Haven, Connecticut. Now, her research is inspiring others.
Hill’s map “nicely identifies potential hazardous areas that we hadn’t noticed before with just overland flooding,” Patrick Barnard, a research geologist with the U.S. Geological Survey’s Pacific Coastal and Marine Science Center, told Circle of Blue.
“It sheds light on a hidden hazard that was not in the conversation before,” Barnard added.
Barnard and his colleagues will release in the next few months a statewide analysis of groundwater response to sea-level rise.
Hill’s groundwater map showed potential flooding hot spots in numerous Bay Area communities: Alameda, Marin City, Redwood City, San Rafael, Tam Valley, and around Lake Merritt in Oakland. Many developments in these areas are built atop former wetlands that were filled in. Draining water from these places can cause subsidence, or sinking of the land surface, a process that also magnifies flood risk. That means that pumping, a favored solution of engineers, is not a simple patch.
Current flood risk maps in the Bay Area are inadequate and underestimate flood risks. The maps do not incorporate groundwater-related flooding or subsidence when looking at future sea-level rise.
The list of maps with blind spots includes Marin County’s sea-level rise vulnerability assessment, published in 2017. That assessment used a “bath tub” model that assumes a relatively uniform rise in bay levels and no wave action. It does not include groundwater-related flood risks.
“There’s always a need to improve predictive tools that we’re using,” Sears, the Marin County supervisor, explained. “We picked the best tools we could at the time we did that assessment.”
The list also includes the San Francisco Bay Conservation and Development Commission’s Adapting to Rising Tides flood map. A state regulatory and planning agency, BCDC is responsible for approving building projects along the bay shoreline.
Brad McCrea, the commission’s regulatory director, said that staff have not looked at groundwater-related flooding when reviewing building permits.
“It’s an emerging issue that everyone is learning about,” McCrea told Circle of Blue.
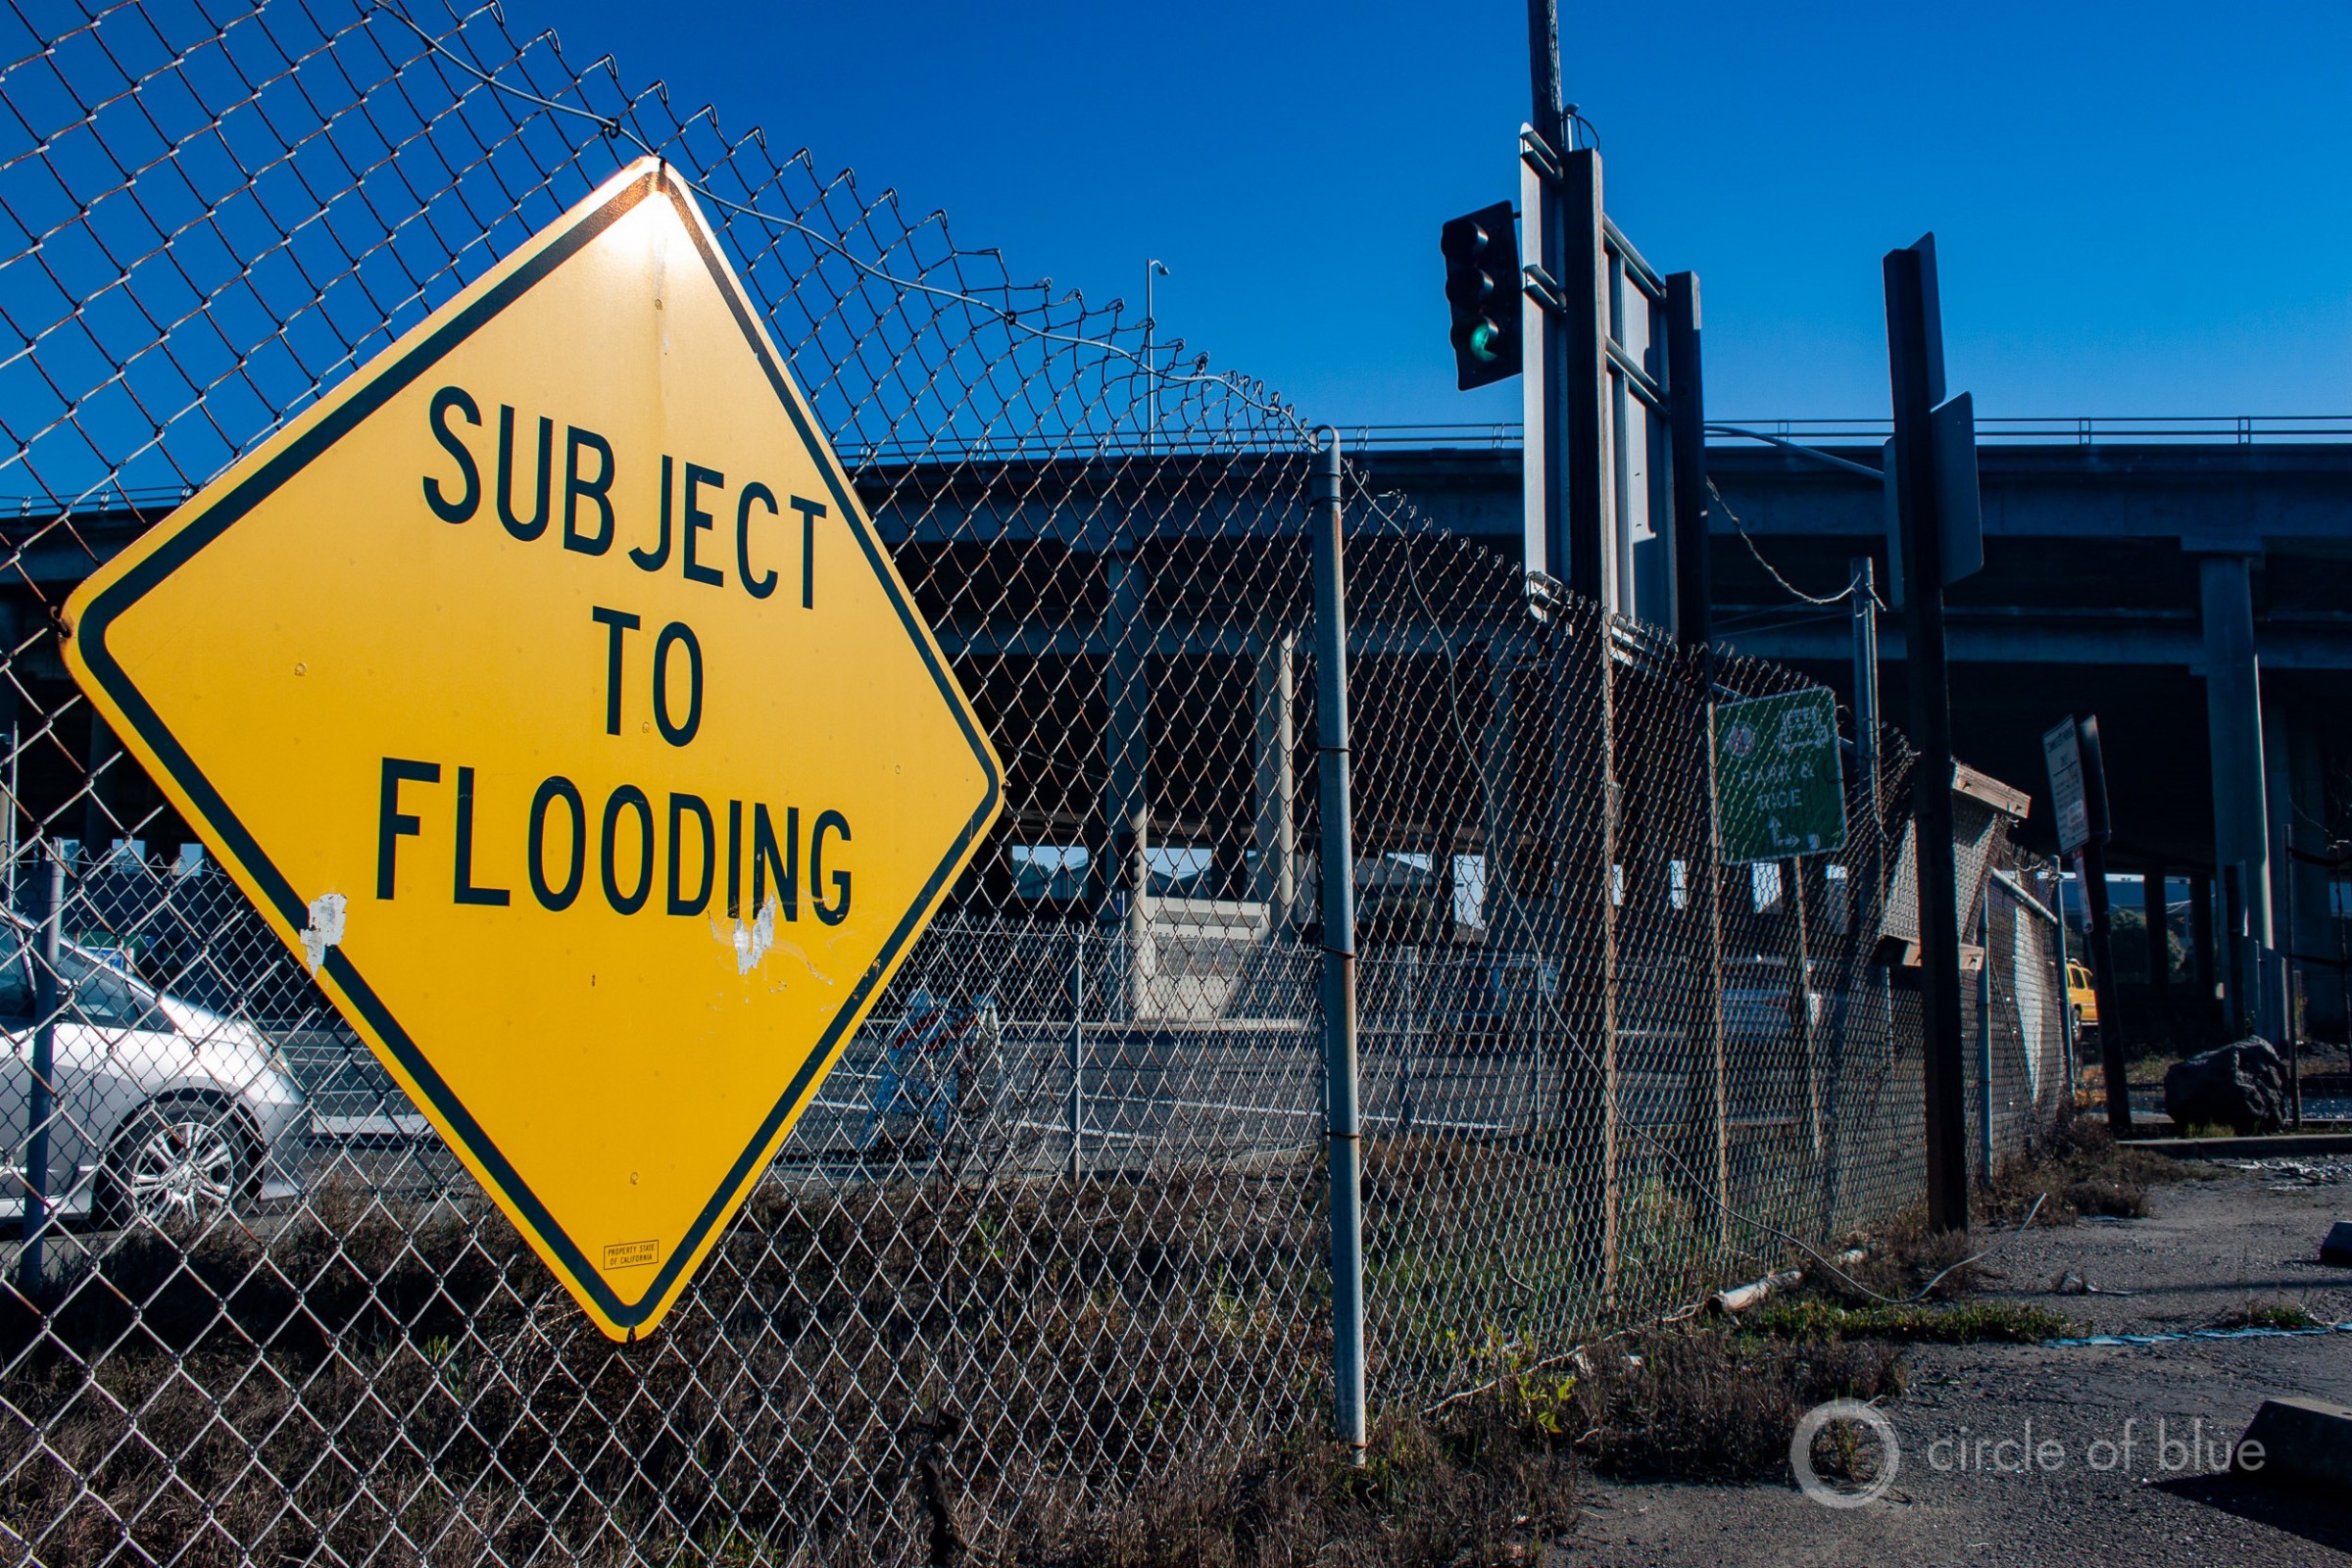
The Manzanita park and ride, located beneath Highway 101 in Marin County, floods during high tides, at least 31 times a year, according to Kate Sears, a county supervisor. “Those of those who live in this area of southern Marin get our feet wet with some regularity,” Sears told Circle of Blue. “It has a significant impact particularly in the Manzanita/Pohono area.” Photo © Brett Walton/Circle of Blue
Ignorance of groundwater-related flooding will undermine — in large and potentially expensive ways — the state’s response to rising waters in the bay, Hill argues.
“Even if we build new walls and levees — with assistance from the state, I hope — we could still see flooding on the inland side of all those levees because the groundwater will equalize with the sea level,” Hill told the Assembly select committee. “So we could spend hundreds of billions of dollars and still have flooding on the inside of those levees.”
Barnard reiterated that groundwater-related flood effects are currently ignored when planning for rising seas.
“Flooding from underground needs to be considered and planned for so that we’re not blowing money on adaption plans that don’t incorporate a range of hazards,” Barnard said.
Hill cautions that groundwater response to sea-level rise unfolds in stages. Flooding is actually the last stage, once groundwater breaks the surface. Before that happens, groundwater can infiltrate sewer pipes and cause damage to building foundations. There is also concern that rising groundwater levels could transport legacy pollutants in the soil in dozens of contaminated sites around the Bay Area.
A New Issue
Lawmakers at the Assembly committee hearing found the testimony compelling – and surprising, in light of the state’s highly publicized struggles with groundwater depletion.
“Who thought that groundwater would be the problem that we’re looking at as well?” Sen. Jerry Hill said in concluding remarks.
Hill, no relation to Kristina, represents portions of two Bay Area counties, San Mateo and Santa Clara.
“See, it’s a new issue for them,” Kristina Hill said in a conversation after the hearing.
“It’s hard for people to track a gradual process,” she added, reflecting on the slow, steady rise of the seas, the bay, and groundwater. “The human brain doesn’t deal well with it.”
Brett writes about agriculture, energy, infrastructure, and the politics and economics of water in the United States. He also writes the Federal Water Tap, Circle of Blue’s weekly digest of U.S. government water news. He is the winner of two Society of Environmental Journalists reporting awards, one of the top honors in American environmental journalism: first place for explanatory reporting for a series on septic system pollution in the United States(2016) and third place for beat reporting in a small market (2014). He received the Sierra Club’s Distinguished Service Award in 2018. Brett lives in Seattle, where he hikes the mountains and bakes pies. Contact Brett Walton





US Federal Reserve Private Bank
Federal and State Energy Policies
Are Poisoning an Killing us
Destroying Our Fragile Life Sustaining Eco-Systems
“Right now the course of our future is being set by the fossil fuel industry, the most powerful corporations in the history of the world, and they’re steering us off a cliff into a raging inferno.
They fight each day to blow up more mountains for coal, demolish more land and oceans for oil and shatter more of the ground beneath our feet by fracking for oil and gas with a cocktail of the most toxic chemicals known to humankind.
With each passing day that these interests set our course, with every additional ton of greenhouse gases emitted like a poison in our atmosphere, the drier the ink becomes on the bleak future written by the fossil fuel industry.
That future is one where oceans drown our coastal homes and cities, where biodiversity is diminished.
It’s a future where droughts will parch our agricultural fields and allow wildfires to run rampant.
It’s a future where clean, freshwater will be among the world’s scarcest resources, and where smog and pollution suffocate our lungs and the planet’s.
Given the fossil fuel industry’s seemingly unlimited money and political influence, changing their course and taking control of our future is a tall order.
But again, we must. And all of you, can make the choices that lead you to seize that control.
I can tell you how significant a difference each of us can make, how important the choices we make can be and the power we have in this country.” John Armstrong
Methane Induced Irradiated Heat
It Is Going To Get Hotter an Wetter
““The amount of water vapor in the atmosphere exists in direct relation to the temperature.
If you increase the temperature, more water evaporates and becomes vapor, and vice versa.
So when something else causes a temperature increase (such as extra CO2 from fossil fuels), more water evaporates.
Then, since water vapor is a green house gas, this additional water vapor causes the temperature to go up even further — a positive feedback.”
Explaining how the Water Vapor Greenhouse effect works; Sceptical Science.
How much does water vapor amplify CO2 warming ?
Studies show that water vapor feed back roughly doubles the amount of warming caused by CO2.
So if there is a 1°C change caused by CO2, the water vapor will cause the temperature to go up another 1°C.
When other feedback loops are included, the total warming from a potential 1°C change caused by CO2 is, in reality, as much as 3°C.
“A warmer atmosphere can hold more moisture, and globally water vapour increases by 7% for every degree centigrade of warming.””Kevin Hester
Carbon 411.78ppm + Methane Natural Gas 2,300ppb + Water Vapour = Global Warming Extreme Deadly Weather Abrupt Climate Changing Sea Level Rising Over 220 Feet
Add 1.9C. Temp Rise Carbon
Add 1.9C. Temp Rise Water Vapour
Add 1.9C. Methane Natural Gas 2,300ppb
…..= 5.7C. Temp Rise Now
Not IPPC 1.9C Global Temp Rise
Record Drought Record Dead
Record Fires Record Floods
Record Highs Record Lows
Record Rain Record Snow
Until Greenland Collapses Then Just Fukushimatized Record Heat Record Rain
This Methane Natural Gas Veil Enveloping The Stratosphere
“IS 65C. Hotter Than Normal” Sam Carana
And Getting Hotter
Since 2005
Perma-Frost
Methane Hydrates
Mantle Methane From Isostatic Rebounding an
Pingoes
Have Been Seeping Spewing an Venting Methane Natural Gas In The Arctic
All That Methane Is Accumulating in The Stratosphere an Warming The Troposphere
Melting Calving Getting Ready To Collapse
Greenland an Antarctica
Antarctica Has Melted The Last Four Years What It took Arctic To Melt In 34 Years
Over 220 Feet of Sea Level Rise
Methane Burp Or Pingoe Popping Pimple and at some point, like Natalia Shakhov, Guy Mcpherson, and Kevin Hester point out, we are going to experience a Methane blow out in the Arctic, from Mantle Methane, Perma-Frost, Methane Hydrates, Pingoes.
The Methane has been telling us, it is going to blow since 2005 by Natalia Shakhov, what was a finger size blow whole in 2005 is now a 200–300 ft. wide blow hole called Pingoes 2015
And their increasing in number and size in Siberia, North American Plate, and on the Euro-Asian Plate
We Are Already Locked in to 20C. Temp Rise an Will go Off The Charts In Heat Even If We Stopped Emitting Now
Methane has a 10 year lag time an Carbon has 30–50 Year Lag time in Reaching its Full Molecule Potential in Holding Heat Mass
Methane has 130 Times More Heat Mass in the Molecule in First Ten years
Then 86 Times More Heat Mass per Molecule over 20 years
Then 34 Times More Heat Mass per Molecule over next 80 Years Than Carbon
440 Nuclear Reactors
450 Nuclear Fuel Rod Pools
Over 1,300 Fuel Rod Pools
Over 14,000 Nuclear Weapons
Over 250,000 Toxic Tons Of Radiated Nuclear Waste
Over 2,000 Nuclear Detonations Excused As Test
We Now Have Methane Natural Gas Irradiated Heat Enveloping The Stratosphere
When Will It Kill us
This Second Minute Hour Today Tonight Tomorrow With In 36 Months
Facebook Google US Federal Reserve Bank Judicial System All Are Deniers an Censor an Punish us For Demanding Change
Shut It Down Leave It In The Ground
We Should Not Throw In The Towel
Now Is The Time To Act
Campaign to Allow Californian Residents to Sell Electricity Obtained by Renewable Energy To the Utility aka Feed In Tariff
We Need a National Feed in Tariff Will you read, sign, and share this petition? https://petitions.moveon.org/sign/let-california-home-owners
Will You Consider Signing and Sharing
Daniel Ferra