
Posts
 https://www.circleofblue.org/wp-content/uploads/2015/04/Screen-Shot-2016-01-04-at-1.23.58-PM.png
455
580
Kaye LaFond
https://www.circleofblue.org/wp-content/uploads/2018/06/Circle-of-Blue-Water-Speaks-600x139.png
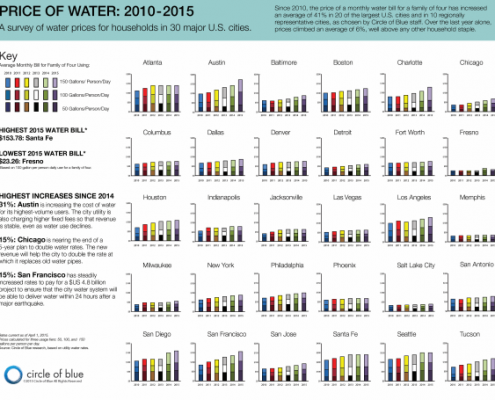
Kaye LaFond2015-04-24 15:09:182016-10-17 14:15:14Infographic: Price of Water in 30 Major U.S. Cities (2010-2015)
https://www.circleofblue.org/wp-content/uploads/2015/04/Screen-Shot-2016-01-04-at-1.23.58-PM.png
455
580
Kaye LaFond
https://www.circleofblue.org/wp-content/uploads/2018/06/Circle-of-Blue-Water-Speaks-600x139.png
Kaye LaFond2015-04-24 15:09:182016-10-17 14:15:14Infographic: Price of Water in 30 Major U.S. Cities (2010-2015)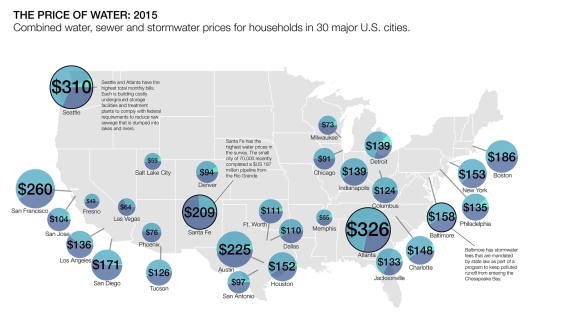 https://www.circleofblue.org/wp-content/uploads/2015/04/waterpricing2015map580.jpg
317
580
Brett Walton
https://www.circleofblue.org/wp-content/uploads/2018/06/Circle-of-Blue-Water-Speaks-600x139.png
Brett Walton2015-04-22 19:41:342017-05-18 11:35:18Price of Water 2015: Up 6 Percent in 30 Major U.S. Cities; 41 Percent Rise Since 2010
https://www.circleofblue.org/wp-content/uploads/2015/04/waterpricing2015map580.jpg
317
580
Brett Walton
https://www.circleofblue.org/wp-content/uploads/2018/06/Circle-of-Blue-Water-Speaks-600x139.png
Brett Walton2015-04-22 19:41:342017-05-18 11:35:18Price of Water 2015: Up 6 Percent in 30 Major U.S. Cities; 41 Percent Rise Since 2010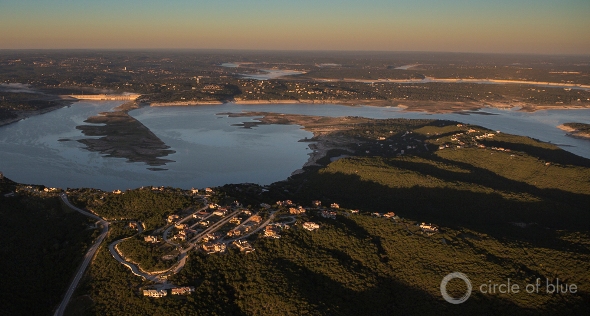 https://www.circleofblue.org/wp-content/uploads/2015/02/©JGanter_Austin_2013_G3_0328_590.jpg
316
590
Brett Walton
https://www.circleofblue.org/wp-content/uploads/2018/06/Circle-of-Blue-Water-Speaks-600x139.png
Brett Walton2015-02-25 21:08:252016-03-14 11:46:37Central Texas Drought Is Worst on Record
https://www.circleofblue.org/wp-content/uploads/2015/02/©JGanter_Austin_2013_G3_0328_590.jpg
316
590
Brett Walton
https://www.circleofblue.org/wp-content/uploads/2018/06/Circle-of-Blue-Water-Speaks-600x139.png
Brett Walton2015-02-25 21:08:252016-03-14 11:46:37Central Texas Drought Is Worst on Record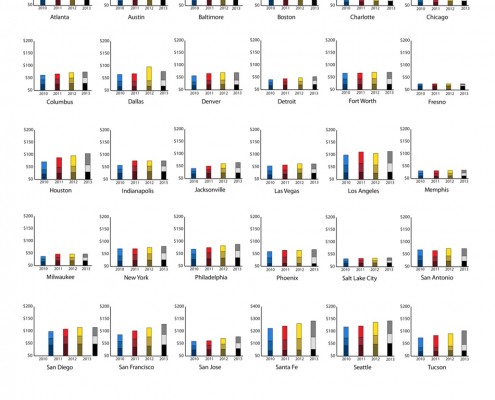 https://www.circleofblue.org/wp-content/uploads/2013/06/2013_30citiestogetherwithkey1-1.jpg
1000
950
Brett Walton
https://www.circleofblue.org/wp-content/uploads/2018/06/Circle-of-Blue-Water-Speaks-600x139.png
Brett Walton2013-06-05 06:00:392017-05-18 11:42:23The Price of Water 2013: Up Nearly 7 Percent in Last Year in 30 Major U.S. Cities; 25 Percent Rise Since 2010
https://www.circleofblue.org/wp-content/uploads/2013/06/2013_30citiestogetherwithkey1-1.jpg
1000
950
Brett Walton
https://www.circleofblue.org/wp-content/uploads/2018/06/Circle-of-Blue-Water-Speaks-600x139.png
Brett Walton2013-06-05 06:00:392017-05-18 11:42:23The Price of Water 2013: Up Nearly 7 Percent in Last Year in 30 Major U.S. Cities; 25 Percent Rise Since 2010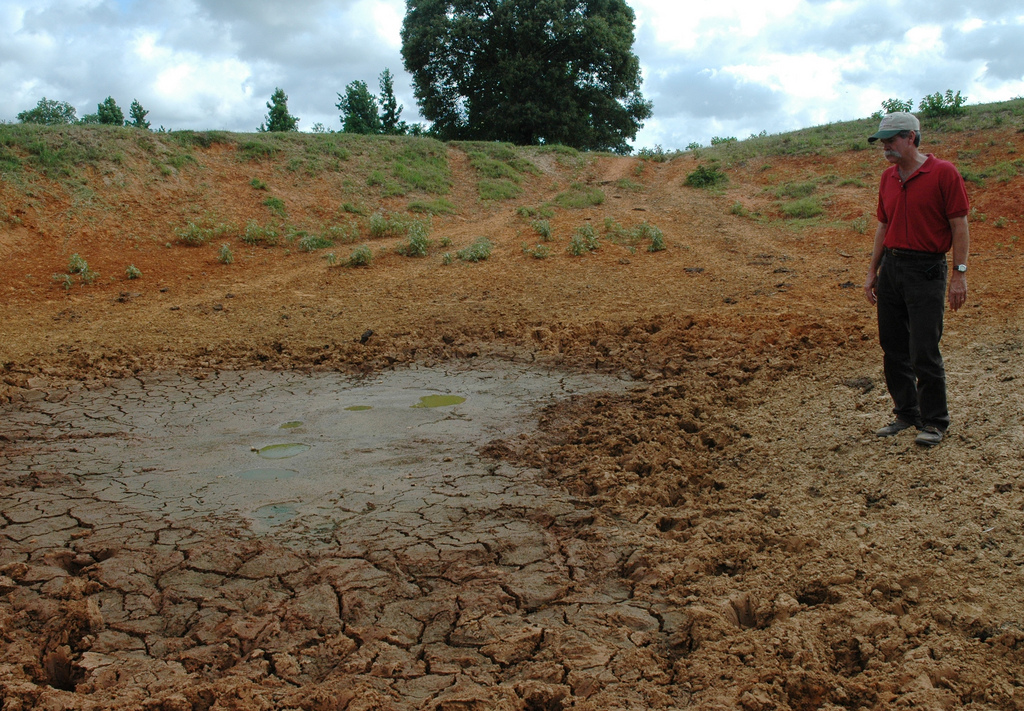 https://www.circleofblue.org/wp-content/uploads/2011/06/texas-drought.jpg
711
1024
Codi Kozacek
https://www.circleofblue.org/wp-content/uploads/2018/06/Circle-of-Blue-Water-Speaks-600x139.png
Codi Kozacek2011-06-22 13:51:492016-04-06 11:41:56Dried Up: Texas Industry and Residents Square Off Over Water as Drought Continues
https://www.circleofblue.org/wp-content/uploads/2011/06/texas-drought.jpg
711
1024
Codi Kozacek
https://www.circleofblue.org/wp-content/uploads/2018/06/Circle-of-Blue-Water-Speaks-600x139.png
Codi Kozacek2011-06-22 13:51:492016-04-06 11:41:56Dried Up: Texas Industry and Residents Square Off Over Water as Drought Continues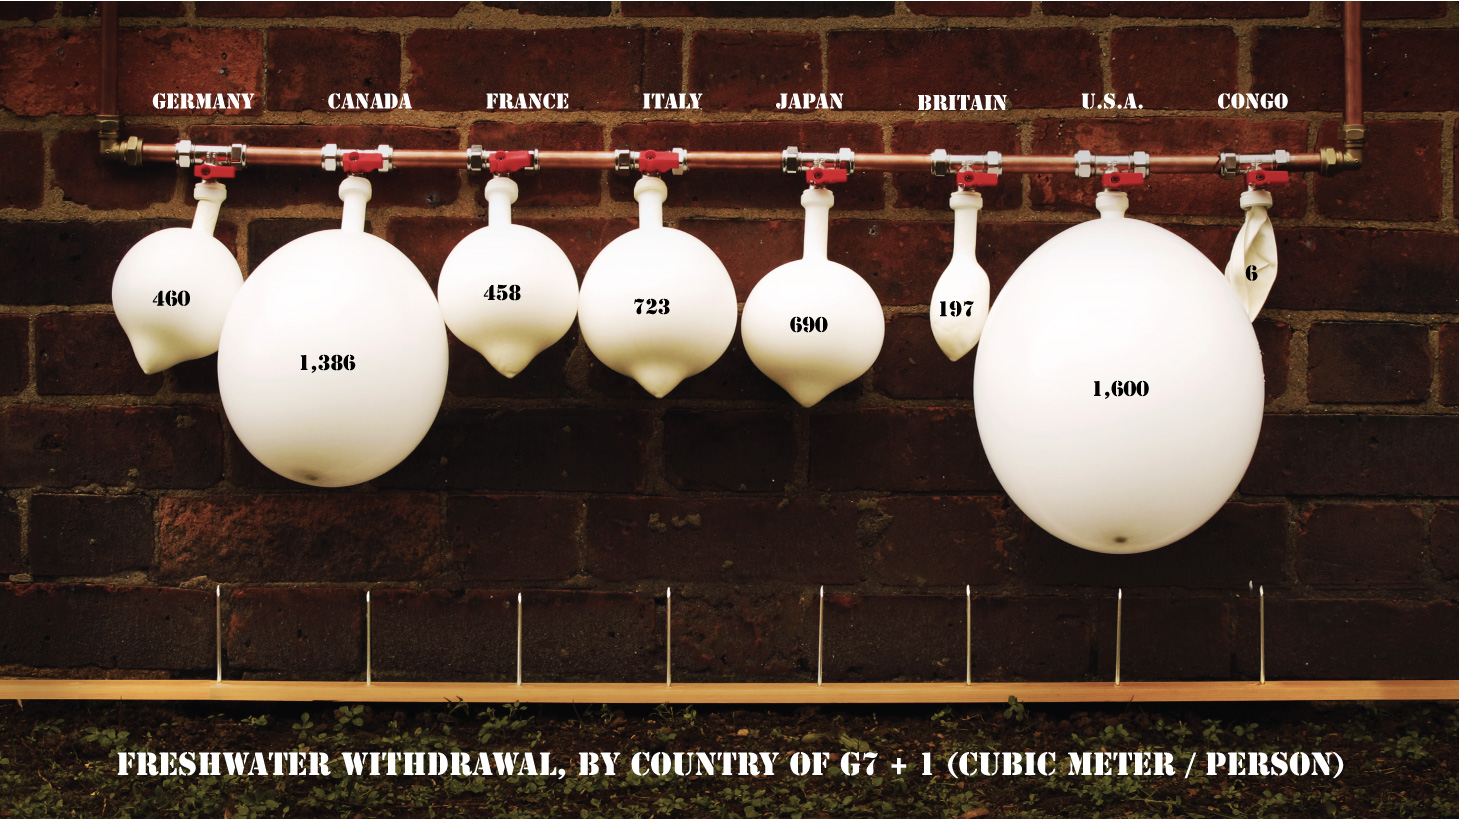 https://www.circleofblue.org/wp-content/uploads/2011/04/freshwater-withdrawals.jpg
819
1459
Circle of Blue
https://www.circleofblue.org/wp-content/uploads/2018/06/Circle-of-Blue-Water-Speaks-600x139.png
Circle of Blue2011-04-17 10:13:192011-04-27 11:42:18Infographic: Freshwater Withdrawal by G7 Country
https://www.circleofblue.org/wp-content/uploads/2011/04/freshwater-withdrawals.jpg
819
1459
Circle of Blue
https://www.circleofblue.org/wp-content/uploads/2018/06/Circle-of-Blue-Water-Speaks-600x139.png
Circle of Blue2011-04-17 10:13:192011-04-27 11:42:18Infographic: Freshwater Withdrawal by G7 Country

