Posts

The Stream, December 27: Evaporation to Exacerbate Western Water Shortages
1 Comment
/
Temperatures nudged higher by climate change will increase evaporation…

The Stream, November 14: Flooding Hits Rome
Extreme Weather
Suburbs, towns and farms outside of Rome flooded…

The Stream, September 28: Brazil’s Agricultural Future Buoyed by Water
Days of heavy rainfall have swollen rivers in the United Kingdom,…

The Stream, August 31: Hurricane Isaac Causes Shipping Headaches on Mississippi
Hurricane Isaac
Hurricane Isaac, which hit land Tuesday evening…

The Stream, August 16: When Wells Run Dry
U.S. Drought Continues
The drought has literally hit home in…

The Stream, June 20: Maryland’s Million-year-old Water
Maryland is sitting atop an aquifer containing water that is…

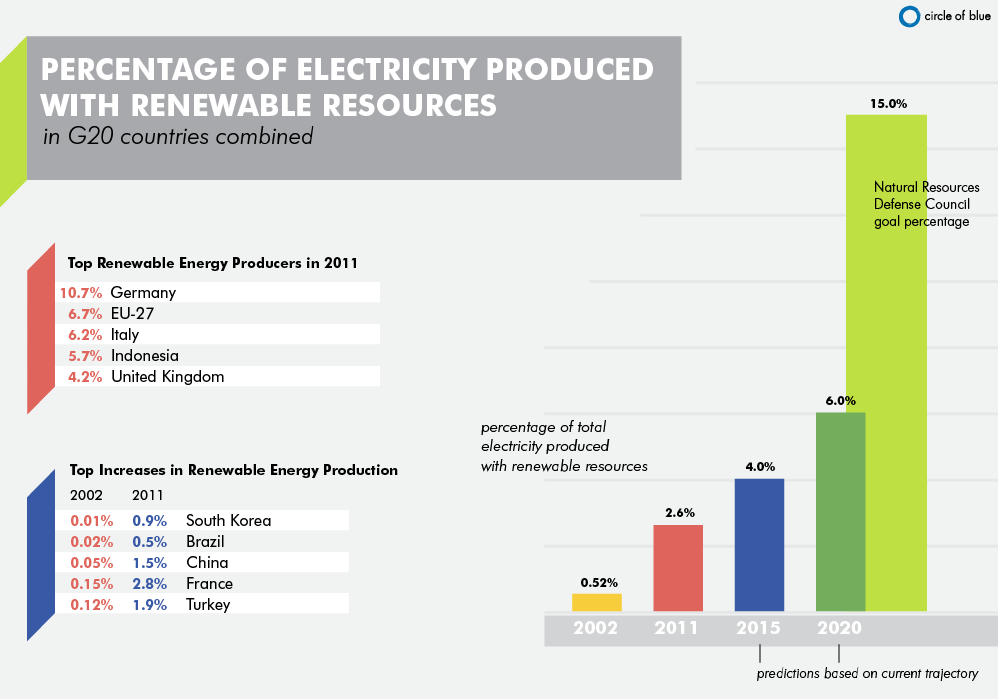
Infographic: G20 Renewable Energy from 2002 to 2020
The NRDC predicts that the G20 will produce less than 4 percent from renewables by 2015 and 6 percent by 2020, up from only 2.6 percent currently and 0.86 percent in 2002.

The Stream, June 13: Land Grabs Threaten Africa’s Water
Large-scale foreign investment in Africa's farmland is a threat…

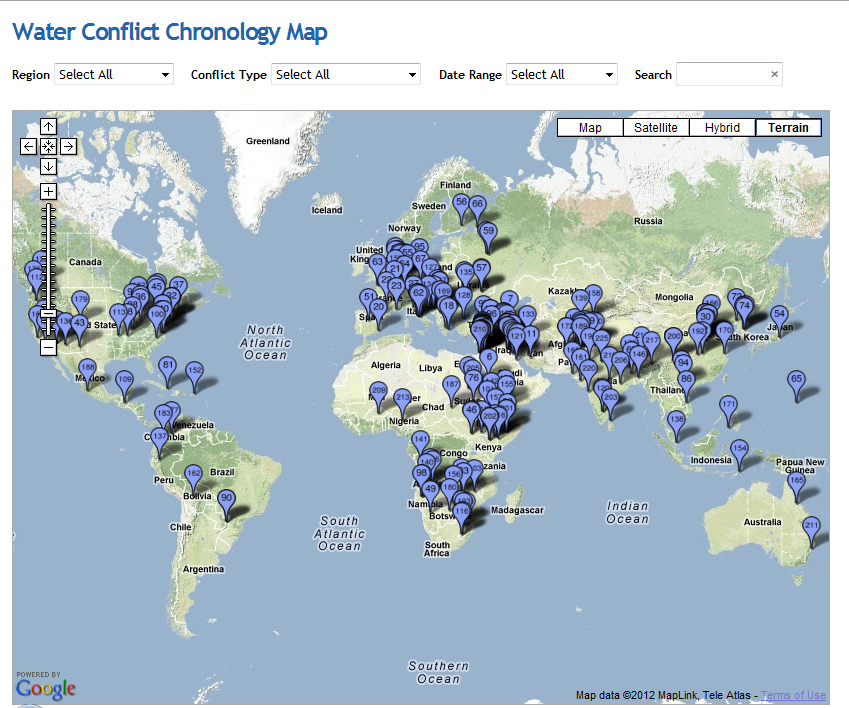
Water As A Weapon — Weapons For Water
Following devastating news of poisoned children in Afghanistan, reporter Codi Yeager look at water security and conflicts around the globe.

The Stream, May 18: Climate Change Will Affect U.S. Water Availability
Water levels on the flooding Rio Negro in Brazil have reached…

The Stream, May 15: America’s Most Endangered Rivers
The Potomac River is the most endangered river in the United…

The Stream, April 19: Australia’s Water Market
New photos published on the Guardian reveal that early construction…

