Posts

Infographic: Water and Energy
2 Comments
/
The emerging collision between the diminishing water supplies and the rising energy demand across the sectors of the U.S. economy.

Japan Considers Wastewater-for-Gas Trade with Qatar
The wastewater would be used as ballast for returning tankers.
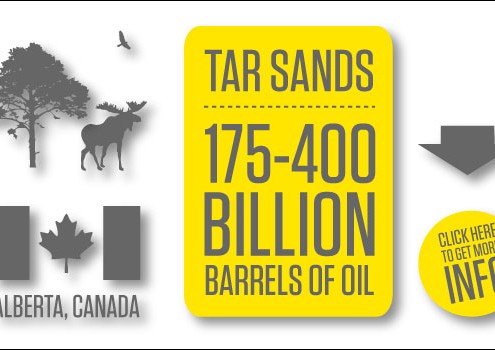
Infographic: A Closer Look at Tar Sands Oil
185 gallons of water + two tons of soil + 700-1200 cubic feet of natural gas
= one barrel of crude oil.
World Bank Report Endorses Integrated Approach to Water Management
Rising population growth and food demand coupled with climate change will test World Bank’s water resource strategy
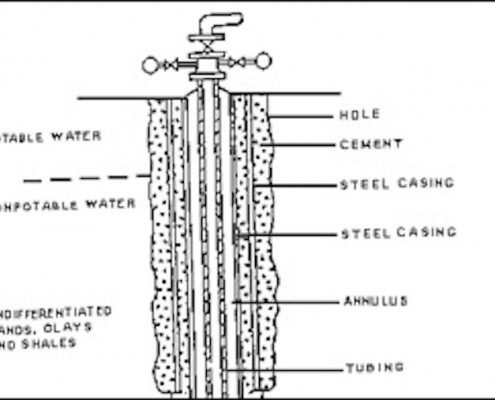
Government Warns Against Contaminated Water in Wyoming Town
Freshwater wells deemed unsafe because of hydrocarbons.
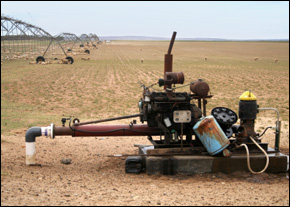
Foreign Investors Becoming Players in Australia’s Water Market
Well-defined water rights, increasing demand, and scarcity projections are attracting investment funds from abroad.
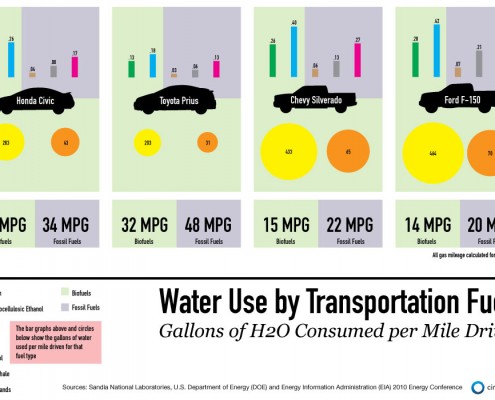
Infographic: Water Use Per Mile Driven — Biofuels vs. Fossil Fuels
A breakdown of gallons of water used by transportation fuels per mile.
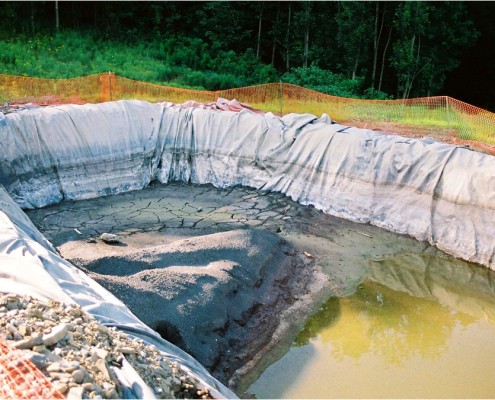
Fracking Regulations Vary Widely from State to State
A look at how states across America are facing deep frack dilemmas.
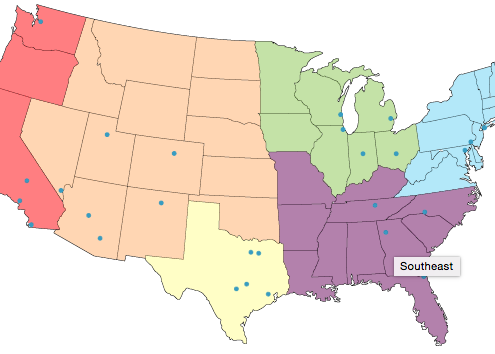
The Price of Wastewater: A Comparison of Sewer Rates in 30 U.S. Cities
Following Circle of Blue’s survey of water prices, we examine the wastewater costs of the same 30 major cities.
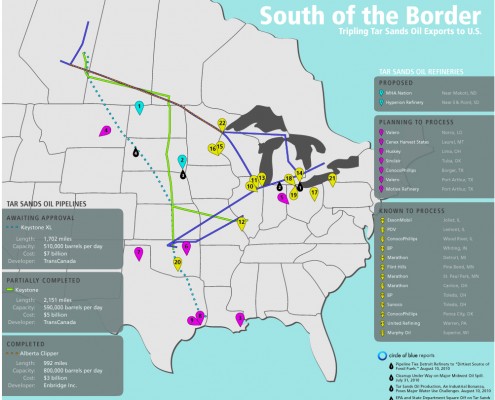
Infographic: Tripling Tar Sands Oil Imports, Pipeline and Refinery Map from Canada to U.S.
The industry is spending billions of dollars to develop more U.S. pipelines.
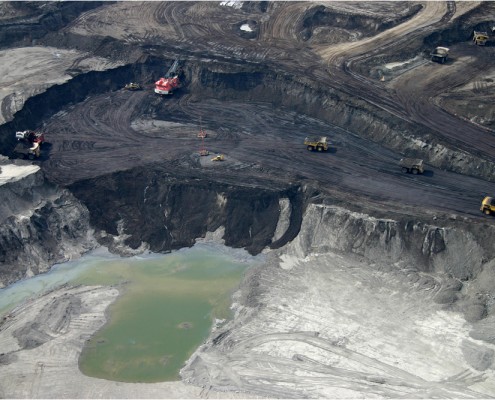
EPA and State Department Square Off On Tar Sands Pipeline
Water use and greenhouse gas emissions are major concerns with oil interests plays.

Peter Gleick: Massive Water Bond Delayed: Back to more Realistic Water Solutions
The California Legislature pulled the massive $11 billion water bond from the November ballot and moved it to 2012.


