Posts

The Stream, October 10: South Sudan’s Looming Food Crisis
0 Comments
/
South Sudan is facing a climate crisis that threatens to deteriorate…

The Stream, October 6: Climate Change in Australia
The weather extremes in Australia are a dress rehearsal for the…

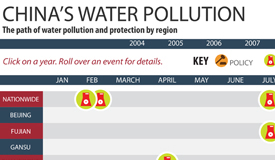
Infographic: China’s Water Pollution Events and Protection Policies (2004-2011)
China has some of the dirtiest and most dangerous water in the world. This detailed and interactive timeline shows key pollution events, protests, and policy reforms from the last eight years at both the national and regional levels as China tries to clean up its act.

The Stream, October 5: Out of Water
Severe water shortages due to the La Nina weather pattern are…

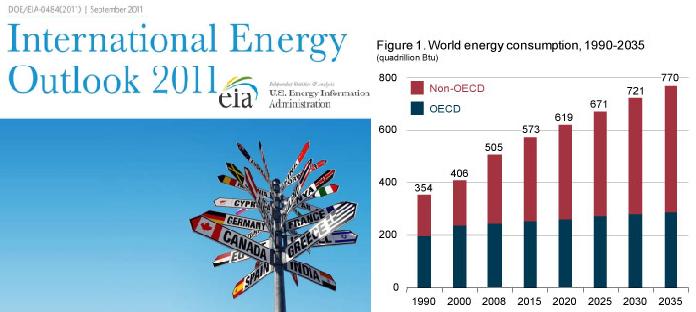
EIA Report: Global Energy Use To Grow 50 Percent by 2035 — Half of Increase from Fossil Fuels in China and India
The U.S. Energy Information Administration recently published its annual report on global energy projections. Though renewable energy sources and nuclear power, along with unconventional fossil fuels, will phase out coal production over the next two decades, it will not be at the pace necessary to offset greenhouse gas emissions

The Stream, October 4: What’s Up With Keystone XL?
More Africans have access to mobile phones than to clean drinking…

The Stream, September 30: Water, Energy, Food
Shale gas will not solve Britain’s energy problems, an Economist…

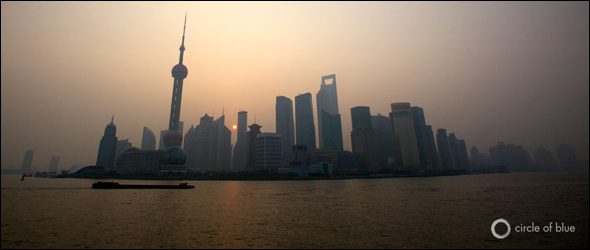
Building China’s 21st-century Megacity: Shanghai’s Experiment with Water and Nature
A new community on the Yangtze River has, so far, been more successful at attracting ducks than people. But city officials have their sights set high for Lingang Port City, which they say could be home to nearly a million people by 2050. Cleaner water will be a big help.

The Stream, September 26: New Approach To Global Food Production
Drought-stricken Texas is desperately behind and short of funds…

The Stream, September 23: Sand Mining and Water Quality
Plans to capture and store carbon have failed to gain traction…

The Stream, September 21: Flood Evacuations
About 1.2 million people have been told to evacuate in western…

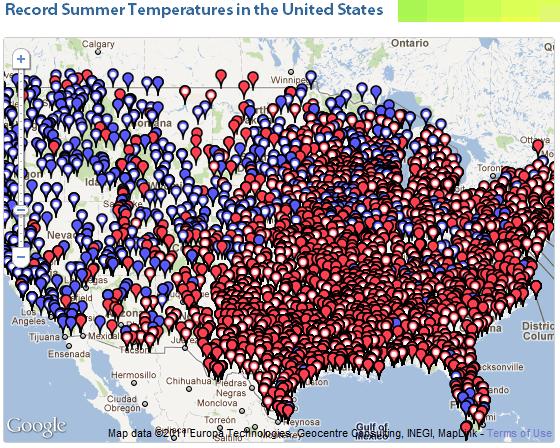
2011 is Record-setting Year for Climate Change: Ice Melts in Arctic, High Temps in U.S.
A new study has revealed that ice volume in the Arctic Sea reached an all-time low in 2010. Meanwhile, in the United States, more high-temperature records have been set this summer than in any other year previously, as well as many regions that have broken rainfall and drought records.


