
Posts
 https://www.circleofblue.org/wp-content/uploads/2010/10/Screen-shot-2013-03-12-at-10.33.57-AM.png
250
592
Circle of Blue
https://www.circleofblue.org/wp-content/uploads/2018/06/Circle-of-Blue-Water-Speaks-600x139.png
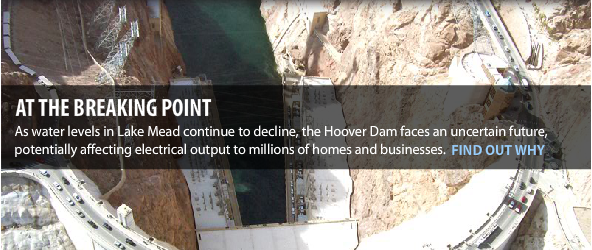
Circle of Blue2014-07-10 17:17:032016-03-10 13:29:19Infographic: Hoover Dam’s Troubled Waters
https://www.circleofblue.org/wp-content/uploads/2010/10/Screen-shot-2013-03-12-at-10.33.57-AM.png
250
592
Circle of Blue
https://www.circleofblue.org/wp-content/uploads/2018/06/Circle-of-Blue-Water-Speaks-600x139.png
Circle of Blue2014-07-10 17:17:032016-03-10 13:29:19Infographic: Hoover Dam’s Troubled Waters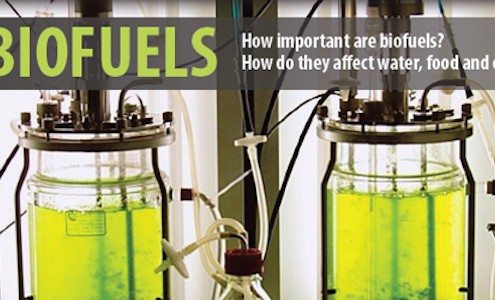 https://www.circleofblue.org/wp-content/uploads/2010/12/biofuels-101-infographic-1.jpg
300
708
Circle of Blue
https://www.circleofblue.org/wp-content/uploads/2018/06/Circle-of-Blue-Water-Speaks-600x139.png
Circle of Blue2010-12-06 15:28:512016-01-07 12:14:35Infographic: Biofuels 101 — Water Use from Plant to Power Source
https://www.circleofblue.org/wp-content/uploads/2010/12/biofuels-101-infographic-1.jpg
300
708
Circle of Blue
https://www.circleofblue.org/wp-content/uploads/2018/06/Circle-of-Blue-Water-Speaks-600x139.png
Circle of Blue2010-12-06 15:28:512016-01-07 12:14:35Infographic: Biofuels 101 — Water Use from Plant to Power Source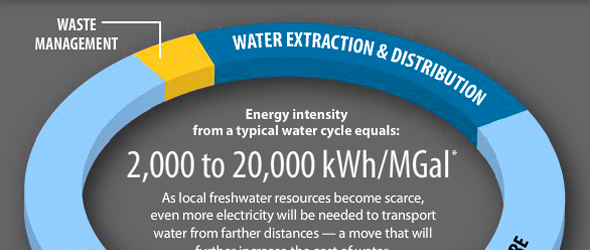 https://www.circleofblue.org/wp-content/uploads/2010/11/energy-used-water-cycle.jpg
250
590
Circle of Blue
https://www.circleofblue.org/wp-content/uploads/2018/06/Circle-of-Blue-Water-Speaks-600x139.png
Circle of Blue2010-11-09 16:20:272016-03-10 13:29:54Infographic: Energy Used in the Water Cycle
https://www.circleofblue.org/wp-content/uploads/2010/11/energy-used-water-cycle.jpg
250
590
Circle of Blue
https://www.circleofblue.org/wp-content/uploads/2018/06/Circle-of-Blue-Water-Speaks-600x139.png
Circle of Blue2010-11-09 16:20:272016-03-10 13:29:54Infographic: Energy Used in the Water Cycle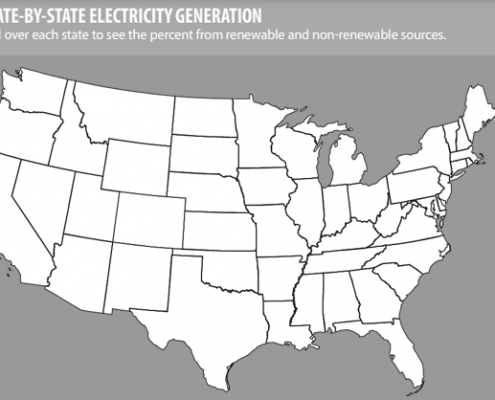 https://www.circleofblue.org/wp-content/uploads/2010/09/Screen-Shot-2016-01-07-at-11.46.28-AM.png
418
575
Circle of Blue
https://www.circleofblue.org/wp-content/uploads/2018/06/Circle-of-Blue-Water-Speaks-600x139.png
Circle of Blue2010-09-22 04:42:142016-01-05 07:08:29Infographic: U.S. Power Sources
https://www.circleofblue.org/wp-content/uploads/2010/09/Screen-Shot-2016-01-07-at-11.46.28-AM.png
418
575
Circle of Blue
https://www.circleofblue.org/wp-content/uploads/2018/06/Circle-of-Blue-Water-Speaks-600x139.png
Circle of Blue2010-09-22 04:42:142016-01-05 07:08:29Infographic: U.S. Power Sources https://www.circleofblue.org/wp-content/uploads/2010/09/water-energy-70.jpg
70
70
Circle of Blue
https://www.circleofblue.org/wp-content/uploads/2018/06/Circle-of-Blue-Water-Speaks-600x139.png
Circle of Blue2010-09-22 04:38:462015-11-24 13:05:39Infographic: State Legislatures Bridge Water-Energy Gap
https://www.circleofblue.org/wp-content/uploads/2010/09/water-energy-70.jpg
70
70
Circle of Blue
https://www.circleofblue.org/wp-content/uploads/2018/06/Circle-of-Blue-Water-Speaks-600x139.png
Circle of Blue2010-09-22 04:38:462015-11-24 13:05:39Infographic: State Legislatures Bridge Water-Energy Gap https://www.circleofblue.org/wp-content/uploads/2010/09/10thing-70.jpg
70
70
Circle of Blue
https://www.circleofblue.org/wp-content/uploads/2018/06/Circle-of-Blue-Water-Speaks-600x139.png
Circle of Blue2010-09-22 04:34:532015-11-24 13:03:58Infographic: 10 Things You Should Know about Water + Energy
https://www.circleofblue.org/wp-content/uploads/2010/09/10thing-70.jpg
70
70
Circle of Blue
https://www.circleofblue.org/wp-content/uploads/2018/06/Circle-of-Blue-Water-Speaks-600x139.png
Circle of Blue2010-09-22 04:34:532015-11-24 13:03:58Infographic: 10 Things You Should Know about Water + Energy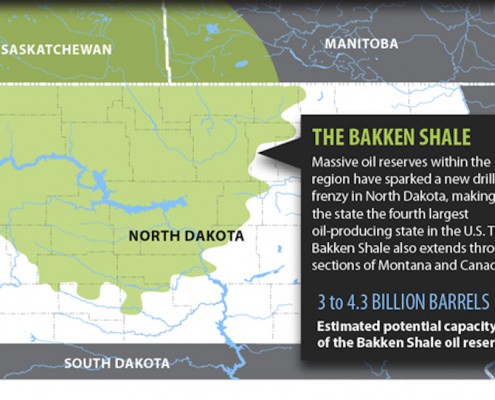 https://www.circleofblue.org/wp-content/uploads/2010/09/index_06-1.jpg
658
1000
Circle of Blue
https://www.circleofblue.org/wp-content/uploads/2018/06/Circle-of-Blue-Water-Speaks-600x139.png
Circle of Blue2010-09-22 04:13:172016-03-10 14:52:57Infographic: North Dakota’s Rise To Domestic Oil Royalty
https://www.circleofblue.org/wp-content/uploads/2010/09/index_06-1.jpg
658
1000
Circle of Blue
https://www.circleofblue.org/wp-content/uploads/2018/06/Circle-of-Blue-Water-Speaks-600x139.png
Circle of Blue2010-09-22 04:13:172016-03-10 14:52:57Infographic: North Dakota’s Rise To Domestic Oil Royalty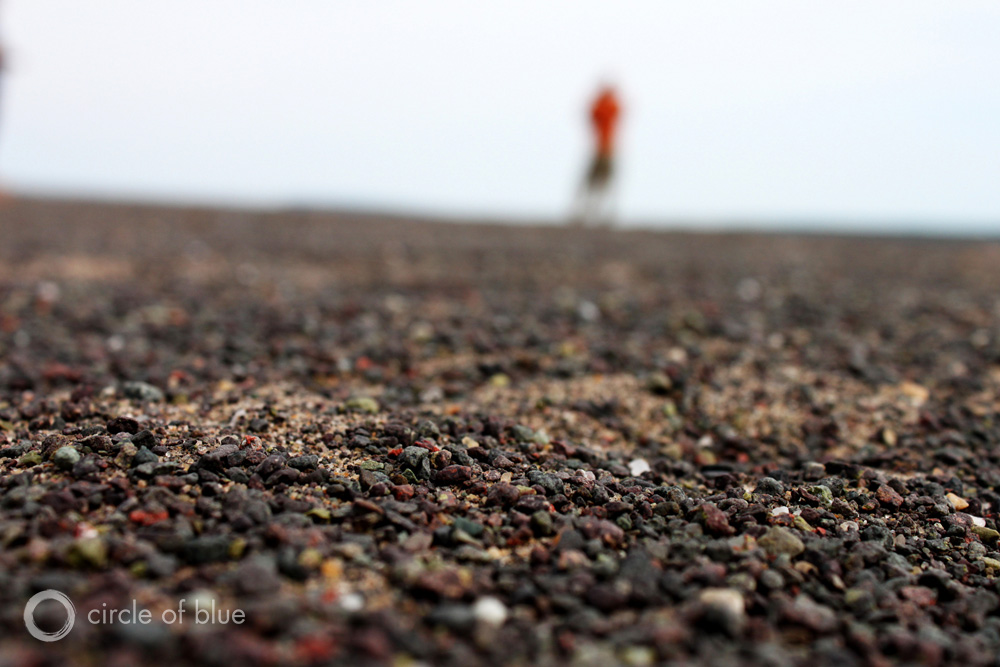 https://www.circleofblue.org/wp-content/uploads/2014/01/StampSands1.jpg
667
1000
Heather Rousseau
https://www.circleofblue.org/wp-content/uploads/2018/06/Circle-of-Blue-Water-Speaks-600x139.png
Heather Rousseau2010-08-30 19:07:292016-01-05 13:59:55Photo Slideshow: Tar Sands Oil Refinery Burdens a Detroit Community
https://www.circleofblue.org/wp-content/uploads/2014/01/StampSands1.jpg
667
1000
Heather Rousseau
https://www.circleofblue.org/wp-content/uploads/2018/06/Circle-of-Blue-Water-Speaks-600x139.png
Heather Rousseau2010-08-30 19:07:292016-01-05 13:59:55Photo Slideshow: Tar Sands Oil Refinery Burdens a Detroit Community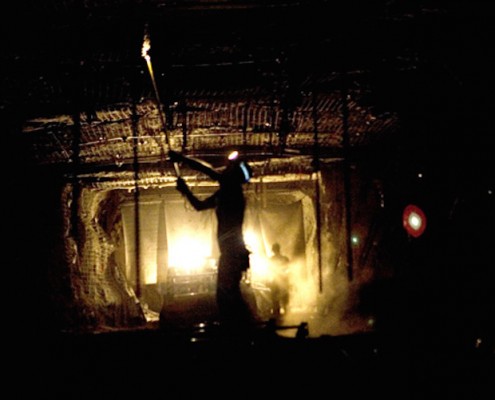 https://www.circleofblue.org/wp-content/uploads/2010/08/coal-suck-water-550x280-3.jpg
501
750
Circle of Blue
https://www.circleofblue.org/wp-content/uploads/2018/06/Circle-of-Blue-Water-Speaks-600x139.png
Circle of Blue2010-08-24 09:22:562016-01-05 14:29:23Photo Slideshow: A Desperate Clinch — Coal Production Across America
https://www.circleofblue.org/wp-content/uploads/2010/08/coal-suck-water-550x280-3.jpg
501
750
Circle of Blue
https://www.circleofblue.org/wp-content/uploads/2018/06/Circle-of-Blue-Water-Speaks-600x139.png
Circle of Blue2010-08-24 09:22:562016-01-05 14:29:23Photo Slideshow: A Desperate Clinch — Coal Production Across America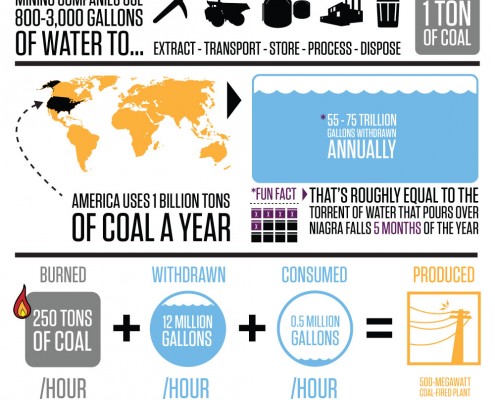 https://www.circleofblue.org/wp-content/uploads/2010/08/WOOD_COALFINAL10001-1.jpg
1060
1000
Kalin Wood
https://www.circleofblue.org/wp-content/uploads/2018/06/Circle-of-Blue-Water-Speaks-600x139.png
Kalin Wood2010-08-16 16:18:272016-02-18 14:40:35Infographic: Coal and Water – A Resource Mismatch
https://www.circleofblue.org/wp-content/uploads/2010/08/WOOD_COALFINAL10001-1.jpg
1060
1000
Kalin Wood
https://www.circleofblue.org/wp-content/uploads/2018/06/Circle-of-Blue-Water-Speaks-600x139.png
Kalin Wood2010-08-16 16:18:272016-02-18 14:40:35Infographic: Coal and Water – A Resource Mismatch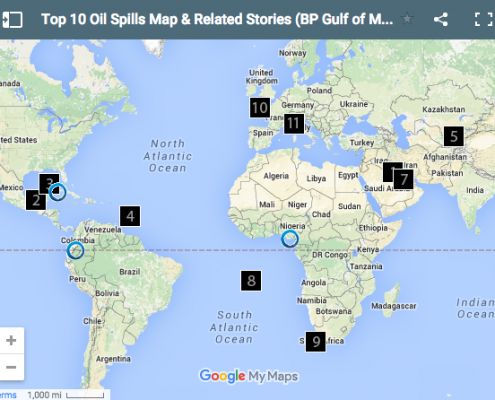 https://www.circleofblue.org/wp-content/uploads/2010/06/Screen-Shot-2016-01-04-at-12.55.34-PM.png
446
588
Circle of Blue
https://www.circleofblue.org/wp-content/uploads/2018/06/Circle-of-Blue-Water-Speaks-600x139.png
Circle of Blue2010-06-22 14:10:472016-01-04 13:09:26Interactive Map: Top Ten Global Oil Spills
https://www.circleofblue.org/wp-content/uploads/2010/06/Screen-Shot-2016-01-04-at-12.55.34-PM.png
446
588
Circle of Blue
https://www.circleofblue.org/wp-content/uploads/2018/06/Circle-of-Blue-Water-Speaks-600x139.png
Circle of Blue2010-06-22 14:10:472016-01-04 13:09:26Interactive Map: Top Ten Global Oil Spills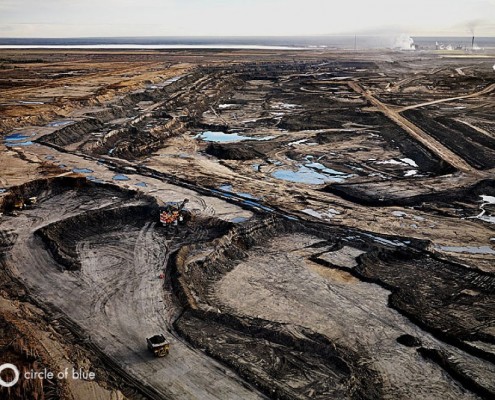 https://www.circleofblue.org/wp-content/uploads/2009/08/Canada-WaterViews-Slideshow.jpg
665
887
Circle of Blue
https://www.circleofblue.org/wp-content/uploads/2018/06/Circle-of-Blue-Water-Speaks-600x139.png
Circle of Blue2009-08-18 03:53:562016-01-23 17:05:31WaterViews | Canada | Slide Show
https://www.circleofblue.org/wp-content/uploads/2009/08/Canada-WaterViews-Slideshow.jpg
665
887
Circle of Blue
https://www.circleofblue.org/wp-content/uploads/2018/06/Circle-of-Blue-Water-Speaks-600x139.png
Circle of Blue2009-08-18 03:53:562016-01-23 17:05:31WaterViews | Canada | Slide Show

