Posts
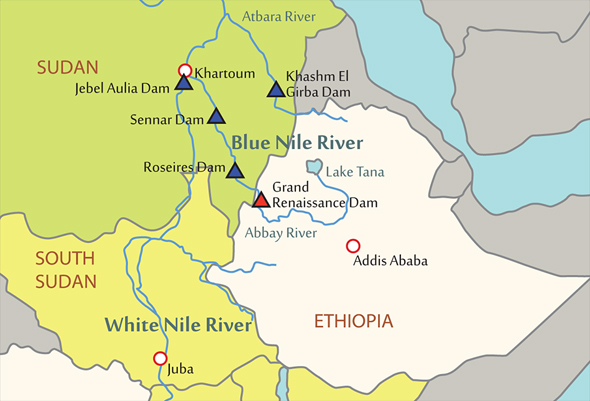
Infographic: Wealth of the Nile — Basin’s Countries, Dams, and GDP per capita
2 Comments
/
Controversy over the Grand Ethiopian Renaissance Dam, which will become the largest dam in Africa when it is completed in 2017, stems from a long history of disputes along the Nile River's 10 countries.
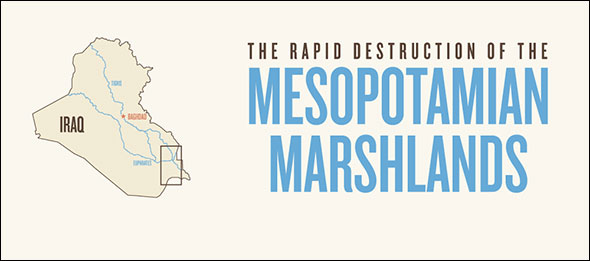
Map: Destruction and Restoration of Iraq’s Mesopotamian Marshlands (1973-2013)
Saddam Hussein's legacy includes draining Iraq’s Mesopotamian Marshland, an integral part of the Tigris-Euphrates River Basin and once the third-largest wetland in the world. Now, the Biblical Garden of Eden is the site of the war-weary nation’s first and only national park.
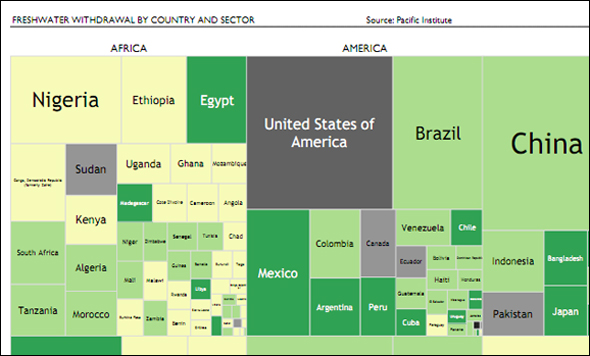
Infographic: Tree Map of Freshwater Withdrawal by Country — A Comparison Between Continents
Does the population of a country affects to its freshwater withdrawal? and its geographic location? Are there differences between Continents? and within them? How the availability of freshwater is spread around the economic sectors?
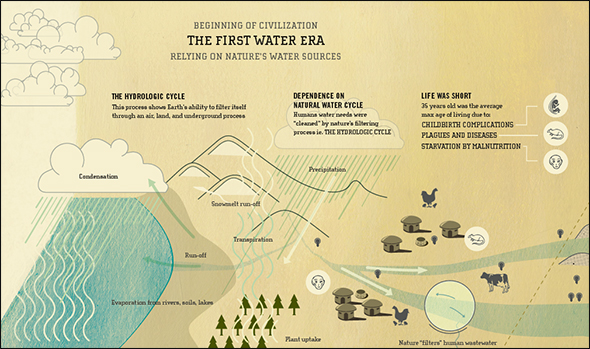
Infographic: Three Eras of Water — The History of the Relationship Between Civilization and Nature
The infographic portrays the evolution of water technology, including its immediate successes of human progress and the disadvantages of that progress. Based on an essay by Peter Gleick, the scientific, social, and historical findings are translated into this piece, putting those patterns in a contemporary light.
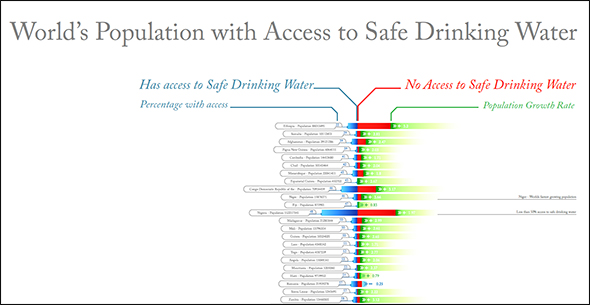
Infographic: World’s Population with Access to Safe Drinking Water
Entry in the 2011 Urban Water Design Challenge, sponsored by…
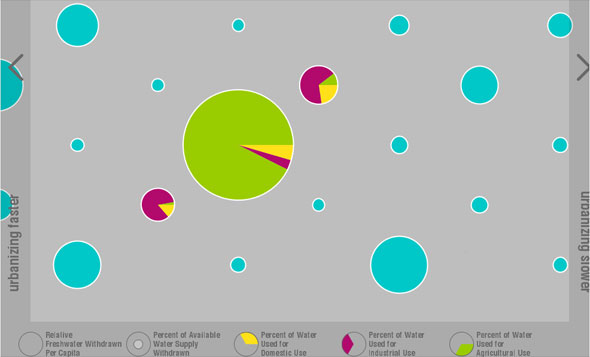
Infographic: Breakdown of Water Consumption and Use in Fastest-Urbanizing Countries
The relative water consumption per capita, percent usage of available freshwater in each country, and the respective breakdowns of use in agricultural, municipal, and industrial sectors are shown for the 120 fastest-urbanizing countries.
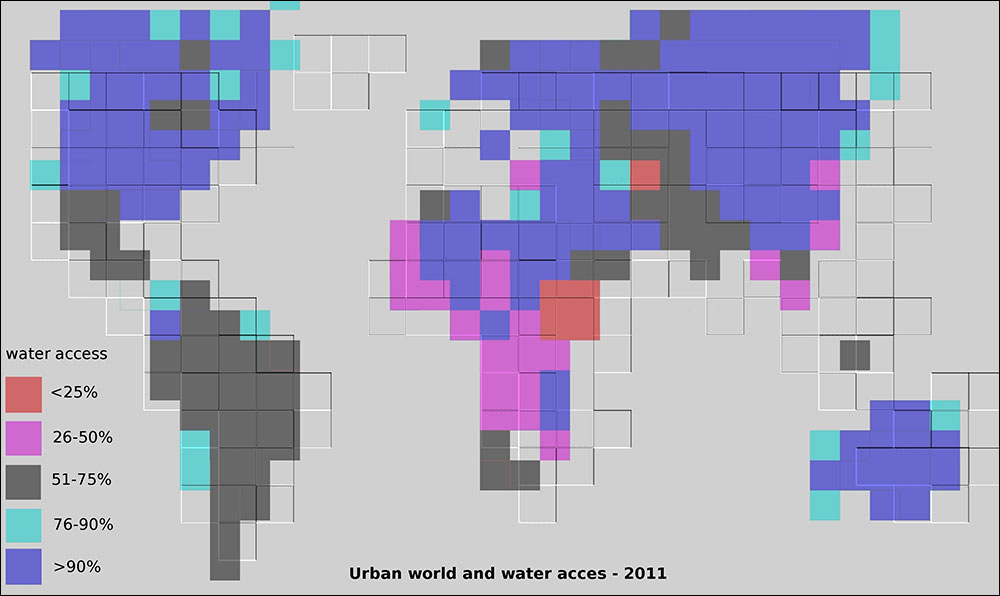
Infographic: Urban Areas vs. Water Access Global Map
This is a global overview of the water access (as a percentage of population) and of the urban factor.
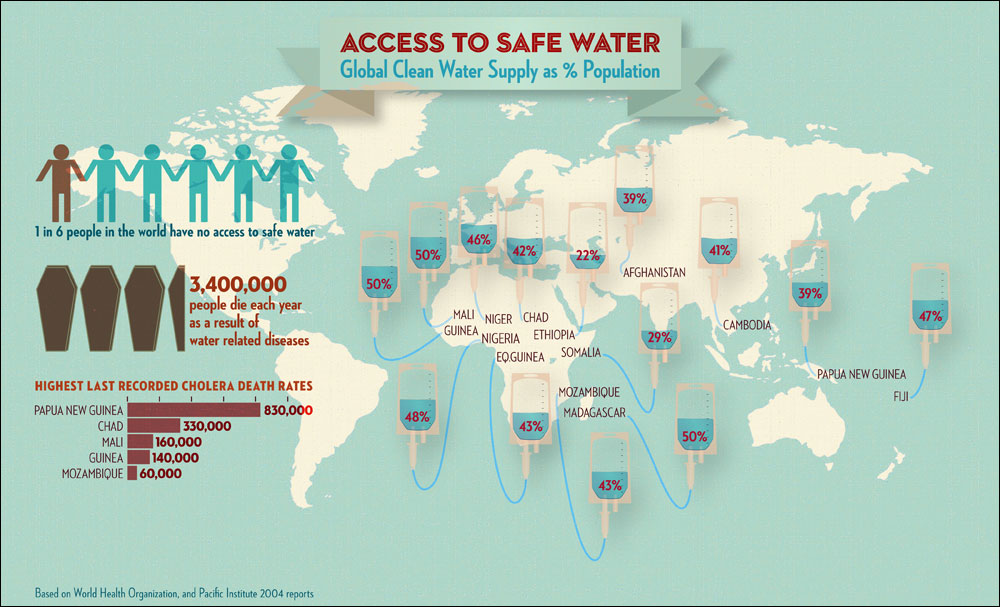
Infographic: Access to Safe Water—Countries Where Less Than 50 Percent Have Access
Global clean water supply by countries those less than 50% of the population can reach, and its facts, based on WHO and Pacific Institute 2004 reports.
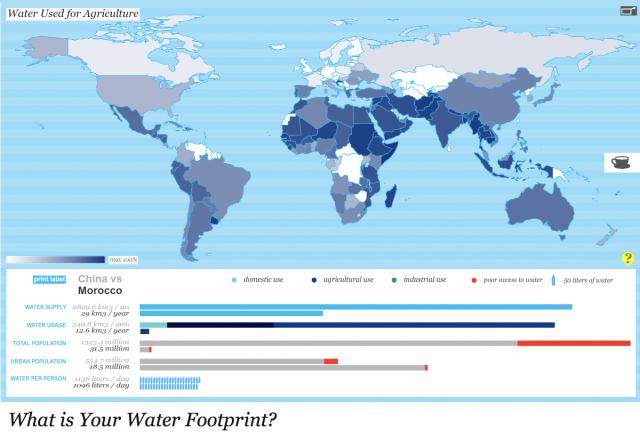
Harvard Students Win Urban Water Design Challenge for Interactive Water Footprint Infographic
Three weeks, 36 entries: Global competition sponsored by Circle of Blue and Visualizing.org.

Ellen Driscoll’s Plastic Lineage
American artist Ellen Driscoll explores resource consumption and material lineage in her latest multi-part, multi-year project, FASTFORWARDFOSSIL.
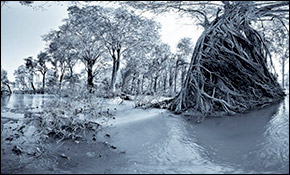
Visioning Flowing Waters, From Laos to Cambodia
Mouth to Source brings remote locations along the Mekong River to life
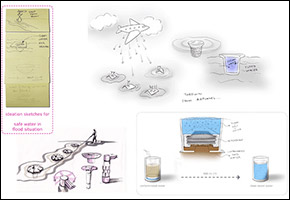 https://www.circleofblue.org/wp-content/uploads/2009/06/dwf.jpg
200
290
J. Carl Ganter
https://www.circleofblue.org/wp-content/uploads/2018/06/Circle-of-Blue-Water-Speaks-600x139.png
J. Carl Ganter2009-06-26 22:13:332010-01-07 18:24:04Update: Designing’s Water Future Finalists


