Posts
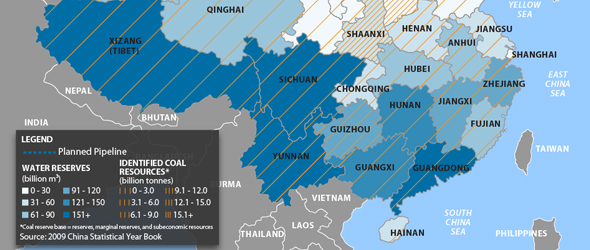
Infographic: Bohai Pipeline Map — Coal Reserves vs. Water Resources in Northern China
0 Comments
/
A look at China's coal-rich, yet water-scarce northern region.
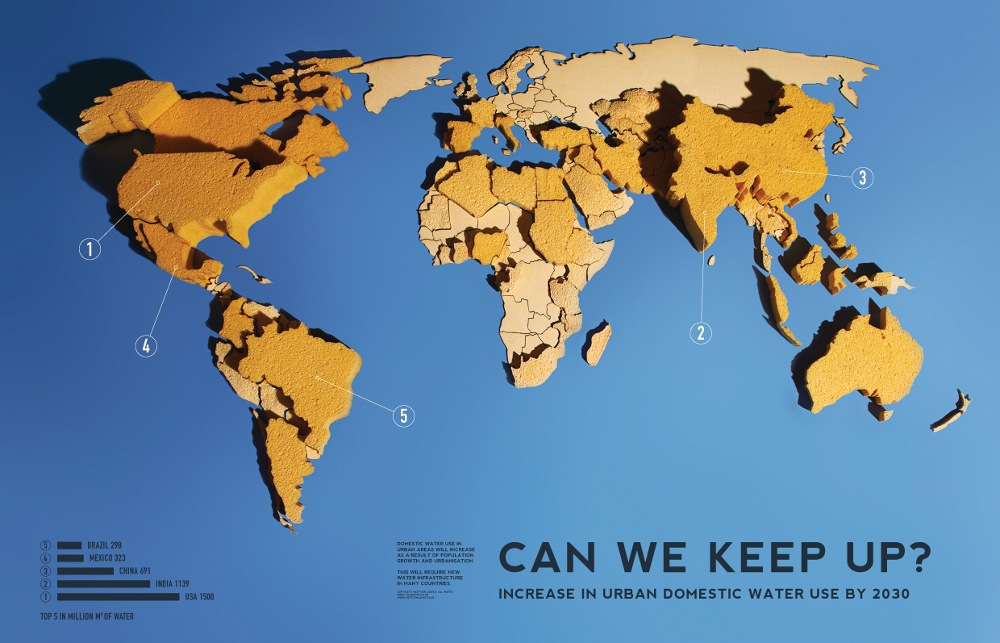
Infographic: Can We Keep Up? Increase in Urban Domestic Water Use by 2030
Runner-up in the 2011 Urban Water Design Challenge, sponsored by Visualizing.org and Circle of Blue.
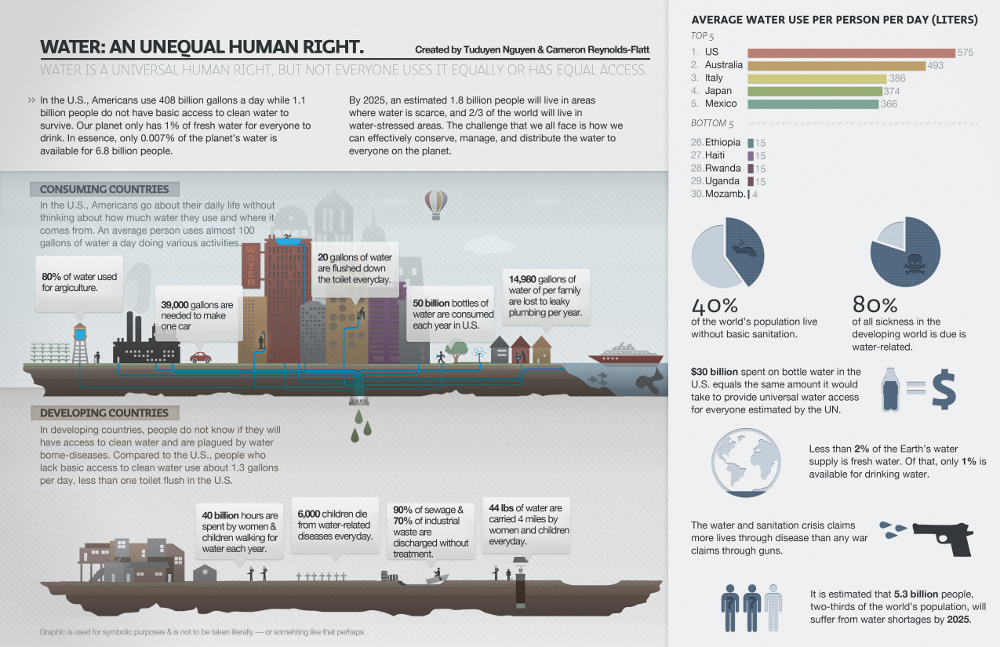
Infographic: Water – An Unequal Human Right
Runner-up in the 2011 Urban Water Design Challenge, sponsored by Visualizing.org and Circle of Blue.
The Stream, March 23: World Water Ranking
Mauritania, Kuwait and Jordan are the most water-stressed countries…
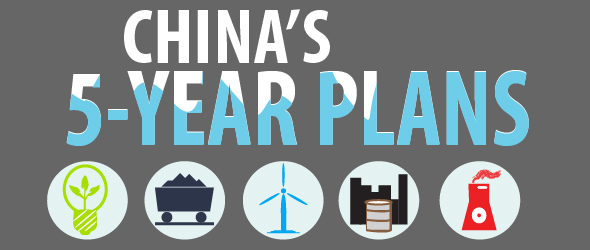
Infographic: Successes and Failures of China’s Five-Year Plans (1996 -2010)
A breakdown of previous plans gives context to the newly released 12th Five-Year Plan.
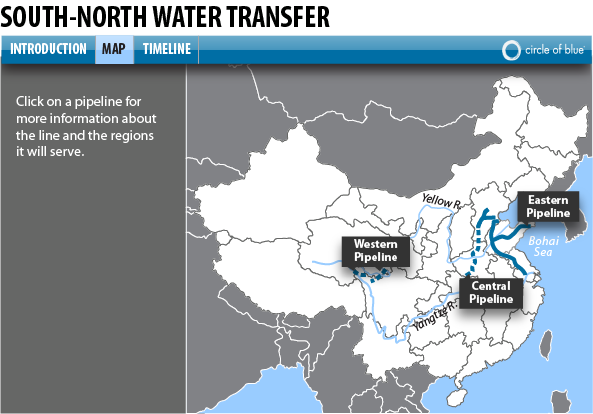
Infographic: China’s South-North Water Transfer Project
Authorities close to the central government say the western line will be built.

Visualizing.org Hosts Urban Water Data Visualization Challenge in Collaboration with Circle of Blue
Visualizing.org, the global open data visualization platform created by Seed Media Group and GE, opened its World Water Day data visualization challenge today in collaboration with Circle of Blue, the leading news organization reporting on global water challenges. The challenge calls on designers, data experts, and visualizers to tap into the world’s stream of water data to create visualizations specifically on the topic of urban water.

Circle of Blue and Ball State University Form Global Multimedia Reporting Project
Collaboration to focus on water, energy, and climate in China and Great Lakes. Immersive program puts advanced students in the center of “one of the decade’s biggest news, policy, and technology issues.”
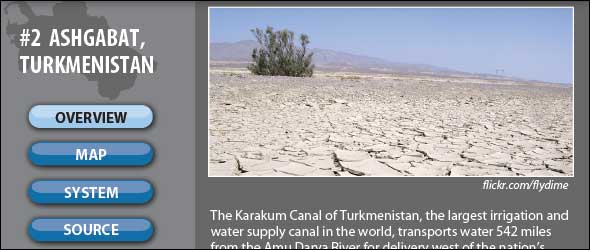
Infographic: Going the Distance, From Ashgabat to Whyalla—10 Cities Pumping Water From Afar
In many cities, water travels far to reach the tap. Residents of the planet's driest places rely on extensive waterways to deliver their supply. Click through the interactive infographic below to learn more about 10 cities that pipe water in from distant aquifers, plus additional plans to expand waterway networks even further.
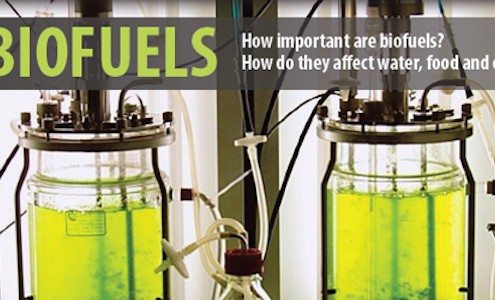
Infographic: Biofuels 101 — Water Use from Plant to Power Source
Production of ethanol, the most commonly used biofuel, has prompted concerns about water use and food supply.
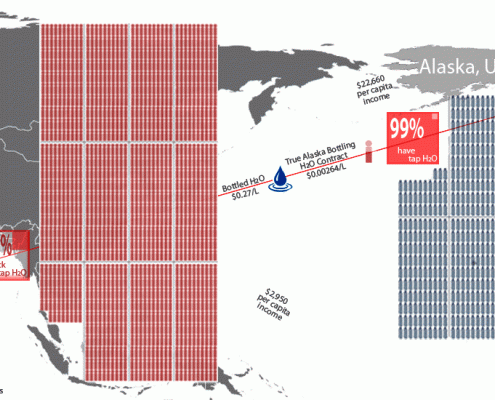
Infographic: Alaska to India Bulk Water Export Data
Sitka, Alaska to send millions of gallons of water to India, which will then be distributed in the Middle East.

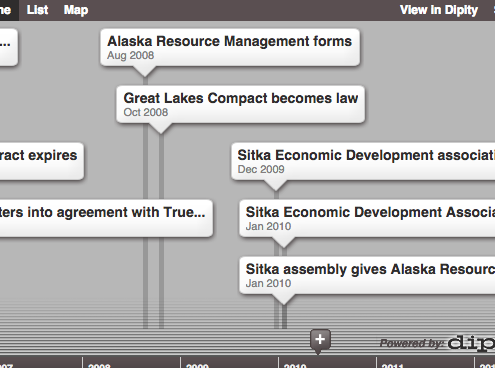
Timeline: North American Bulk Water Sales
Bulk water has been attempted and banned around the world. Visualize the last decade of attempts in Sitka.


