
Posts
 https://www.circleofblue.org/wp-content/uploads/2015/04/Screen-Shot-2016-01-04-at-1.23.58-PM.png
455
580
Kaye LaFond
https://www.circleofblue.org/wp-content/uploads/2018/06/Circle-of-Blue-Water-Speaks-600x139.png
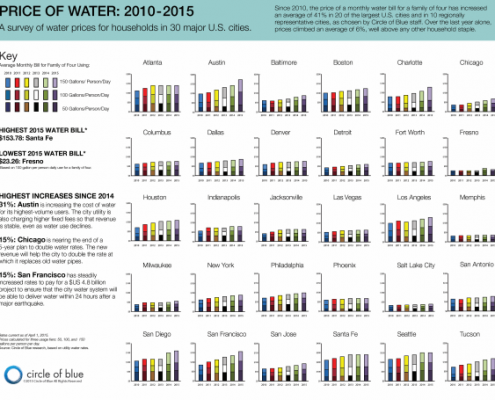
Kaye LaFond2015-04-24 15:09:182016-10-17 14:15:14Infographic: Price of Water in 30 Major U.S. Cities (2010-2015)
https://www.circleofblue.org/wp-content/uploads/2015/04/Screen-Shot-2016-01-04-at-1.23.58-PM.png
455
580
Kaye LaFond
https://www.circleofblue.org/wp-content/uploads/2018/06/Circle-of-Blue-Water-Speaks-600x139.png
Kaye LaFond2015-04-24 15:09:182016-10-17 14:15:14Infographic: Price of Water in 30 Major U.S. Cities (2010-2015)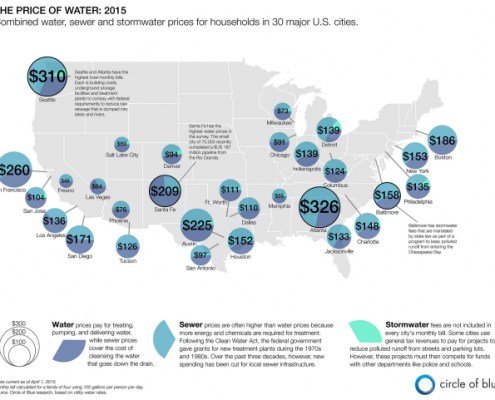 https://www.circleofblue.org/wp-content/uploads/2015/04/Screen-Shot-2016-01-04-at-1.27.32-PM.png
481
633
Kaye LaFond
https://www.circleofblue.org/wp-content/uploads/2018/06/Circle-of-Blue-Water-Speaks-600x139.png
Kaye LaFond2015-04-24 14:10:332016-10-14 10:01:50Infographic: 2015 Price of U.S. Water, Sewer, and Stormwater
https://www.circleofblue.org/wp-content/uploads/2015/04/Screen-Shot-2016-01-04-at-1.27.32-PM.png
481
633
Kaye LaFond
https://www.circleofblue.org/wp-content/uploads/2018/06/Circle-of-Blue-Water-Speaks-600x139.png
Kaye LaFond2015-04-24 14:10:332016-10-14 10:01:50Infographic: 2015 Price of U.S. Water, Sewer, and Stormwater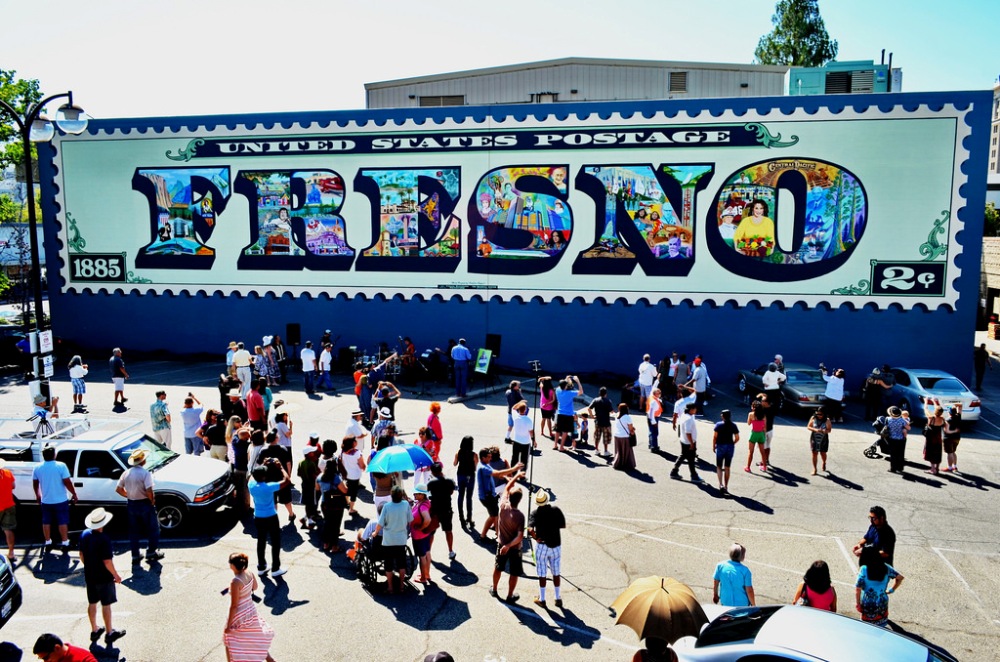 https://www.circleofblue.org/wp-content/uploads/2014/12/Fresno.jpg
662
1000
Brett Walton
https://www.circleofblue.org/wp-content/uploads/2018/06/Circle-of-Blue-Water-Speaks-600x139.png
Brett Walton2014-05-07 18:25:262016-01-22 13:58:34Water Levels Dropping, Fresno Weans Itself from Groundwater
https://www.circleofblue.org/wp-content/uploads/2014/12/Fresno.jpg
662
1000
Brett Walton
https://www.circleofblue.org/wp-content/uploads/2018/06/Circle-of-Blue-Water-Speaks-600x139.png
Brett Walton2014-05-07 18:25:262016-01-22 13:58:34Water Levels Dropping, Fresno Weans Itself from Groundwater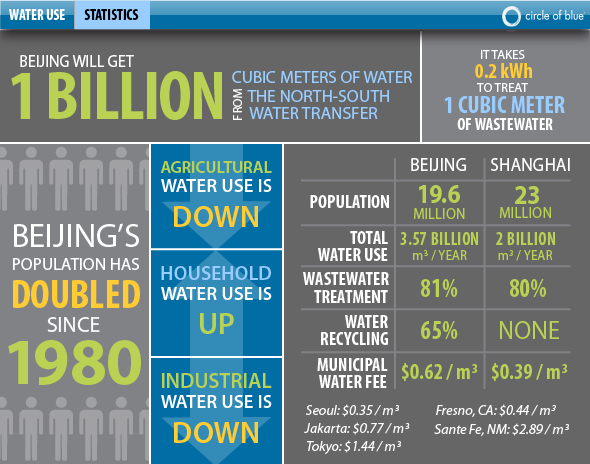 https://www.circleofblue.org/wp-content/uploads/2011/05/stats-01.png
464
590
Circle of Blue
https://www.circleofblue.org/wp-content/uploads/2018/06/Circle-of-Blue-Water-Speaks-600x139.png
Circle of Blue2011-05-06 07:43:012015-12-13 22:11:10Infographic: Beijing Water Use and Population Statistics
https://www.circleofblue.org/wp-content/uploads/2018/06/Circle-of-Blue-Water-Speaks-600x139.png
0
0
Sarah Haughn
https://www.circleofblue.org/wp-content/uploads/2018/06/Circle-of-Blue-Water-Speaks-600x139.png
Sarah Haughn2008-07-24 12:30:302015-12-14 15:11:09Calif. water levels historically low
https://www.circleofblue.org/wp-content/uploads/2011/05/stats-01.png
464
590
Circle of Blue
https://www.circleofblue.org/wp-content/uploads/2018/06/Circle-of-Blue-Water-Speaks-600x139.png
Circle of Blue2011-05-06 07:43:012015-12-13 22:11:10Infographic: Beijing Water Use and Population Statistics
https://www.circleofblue.org/wp-content/uploads/2018/06/Circle-of-Blue-Water-Speaks-600x139.png
0
0
Sarah Haughn
https://www.circleofblue.org/wp-content/uploads/2018/06/Circle-of-Blue-Water-Speaks-600x139.png
Sarah Haughn2008-07-24 12:30:302015-12-14 15:11:09Calif. water levels historically low

