Posts
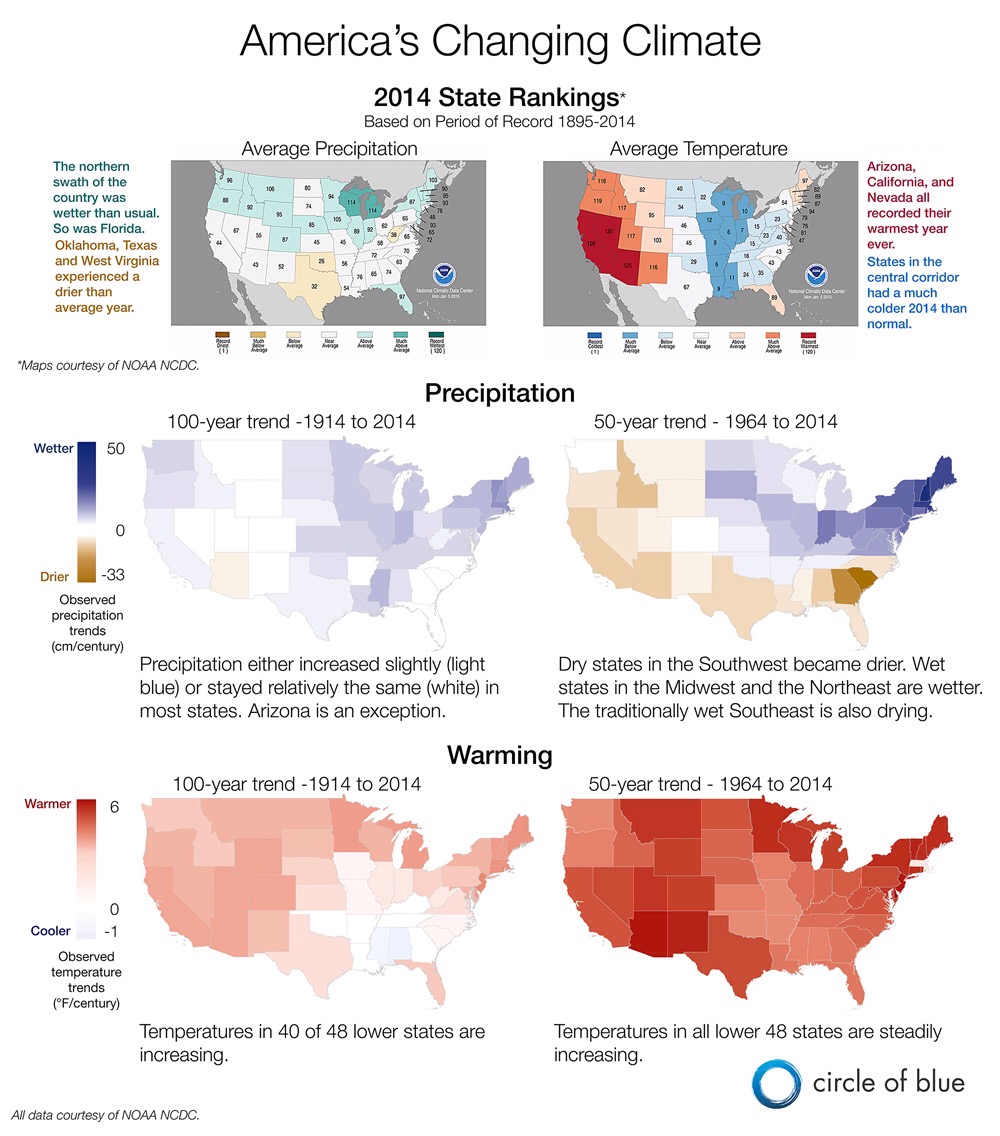
Infographic: The Drier, Wetter, Warming U.S.
0 Comments
/
Despite warm and cold extremes in 2014, precipitation and temperature…
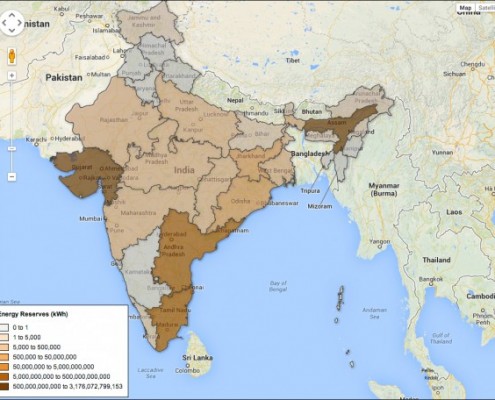
Map: India’s Energy Reserves, Capacity, and Potential Renewable Energy (2008-2012)
Click through the interactive infographic to see how India, the world’s fastest-growing nation with the second-highest population, races to meet rising demand for energy.
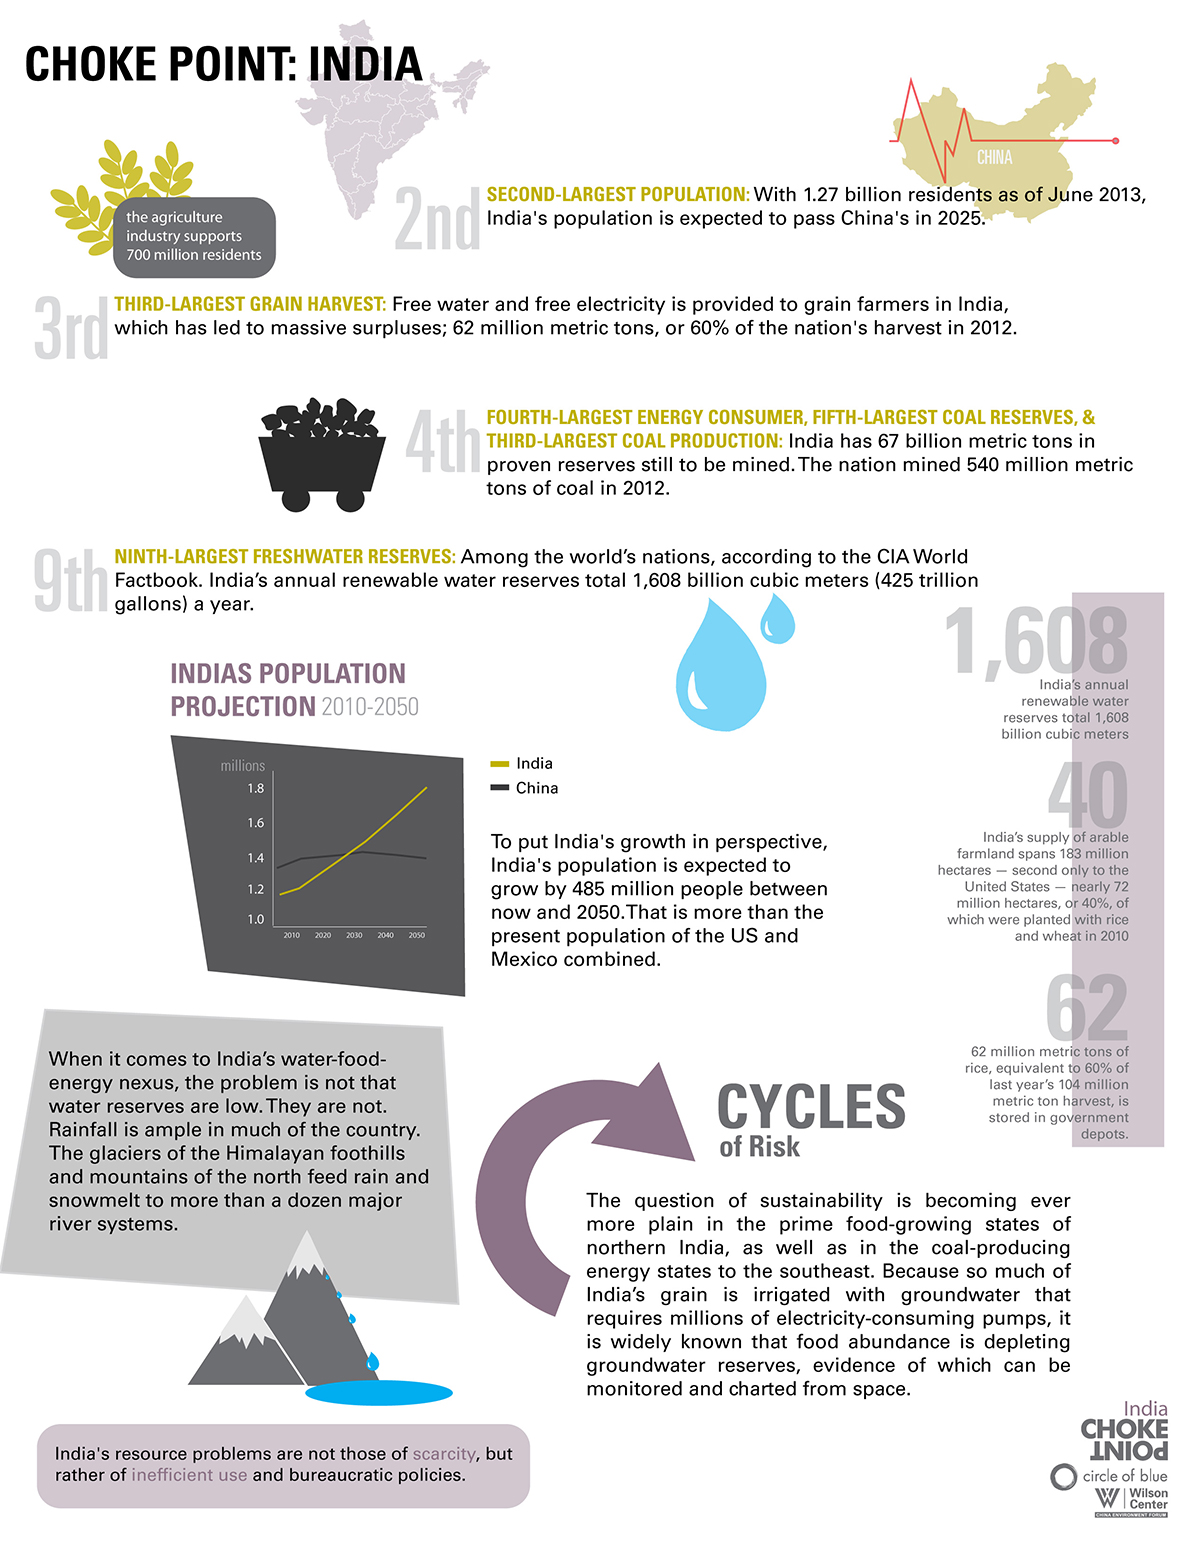
Infographic: Water, Food, and Energy Choke Points in India
India's resource problems are not those of scarcity, but rather of inefficient use and bureaucratic policies.
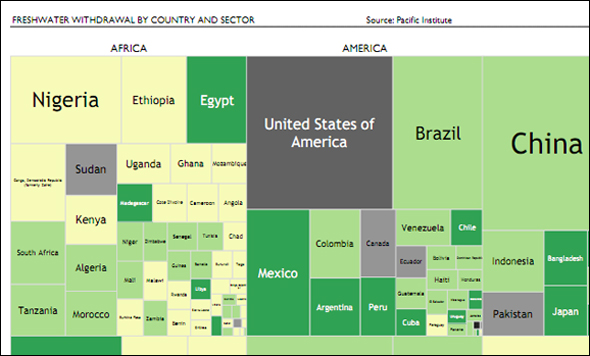
Infographic: Tree Map of Freshwater Withdrawal by Country — A Comparison Between Continents
Does the population of a country affects to its freshwater withdrawal? and its geographic location? Are there differences between Continents? and within them? How the availability of freshwater is spread around the economic sectors?
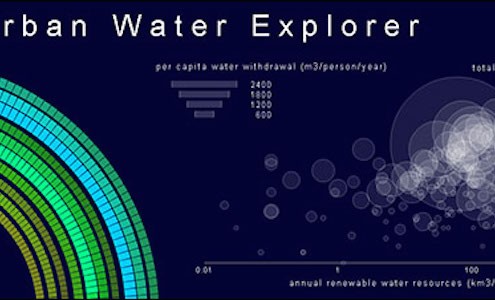
Infographic: Interactive Urban Water Explorer
Entry in the 2011 Urban Water Design Challenge, sponsored by Visualizing.org and Circle of Blue.
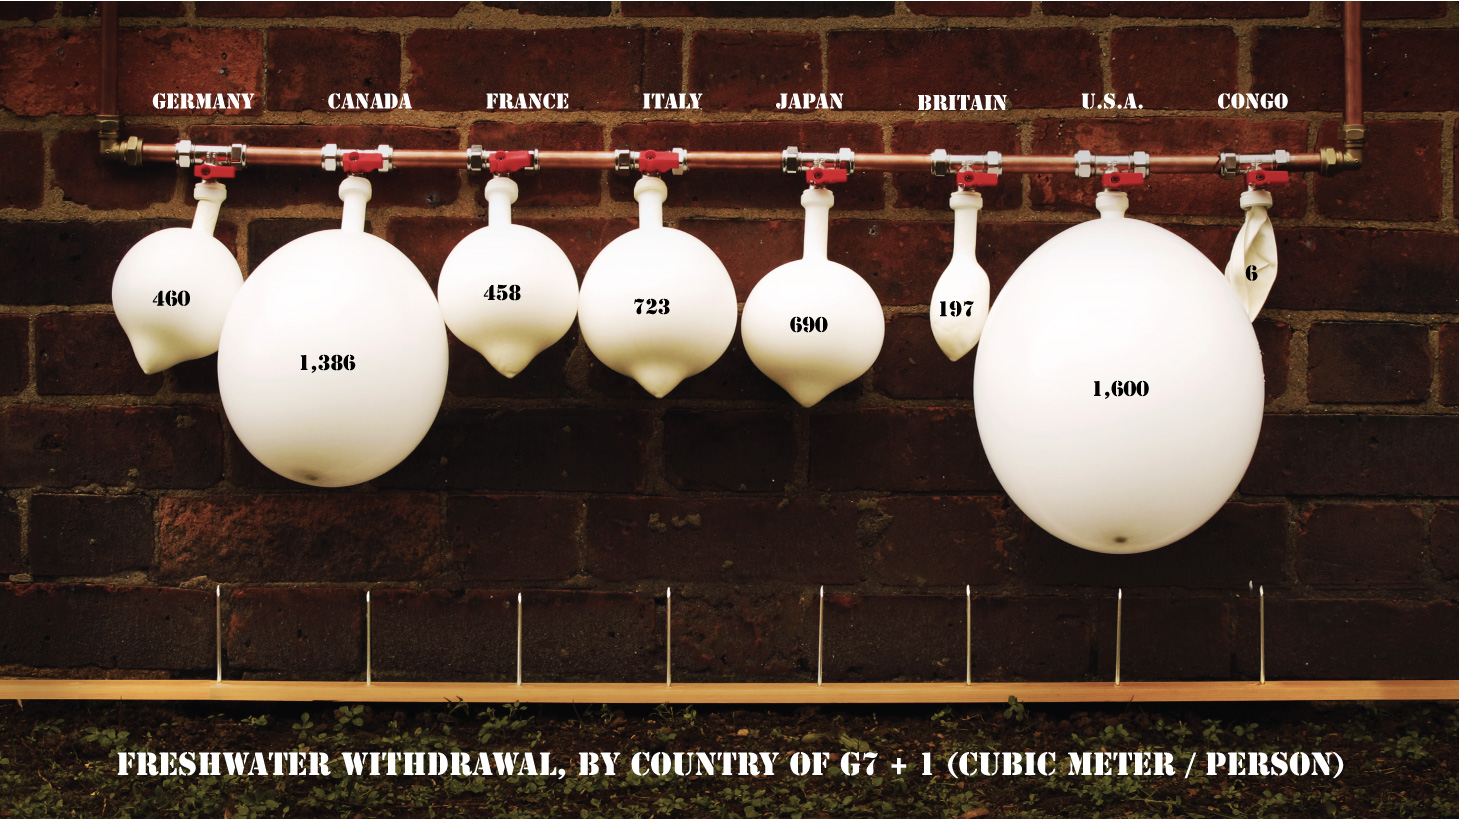
Infographic: Freshwater Withdrawal by G7 Country
This visualization visually and physically describes the freshwater withdrawal per capita from the G7 and another nation.
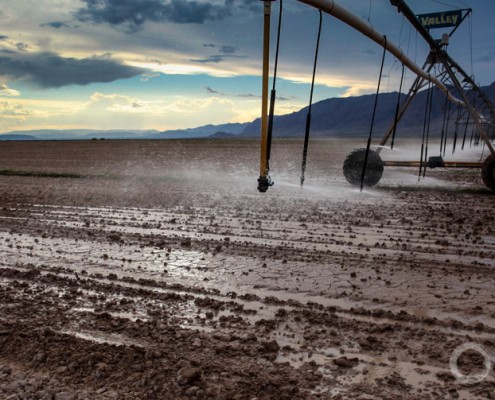
Coming Era of Water Scarcity Will Prompt Global Industrial Transformation, According to Survey of International Experts
WASHINGTON, D.C. – Population growth, urban development, farm production, and climate change is increasing competition for fresh water and producing shortages so acute that virtually every industry in the world anticipates sweeping systemic transformation over the next decade in their strategic planning, production practices, and business models.
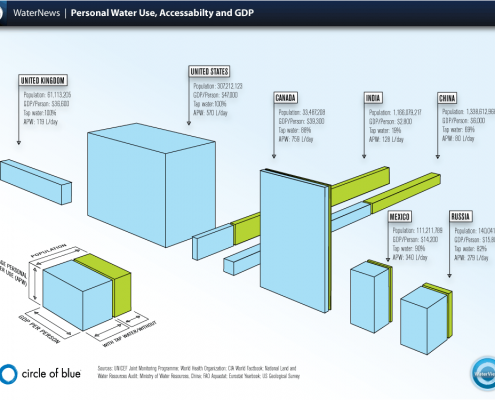
WaterViews | Infographics
Infographics by Hannah Nester for Circle of Blue. Produced as part of the WaterViews project.
 https://www.circleofblue.org/wp-content/uploads/2009/07/craterlake.jpg
200
290
Cody Pope
https://www.circleofblue.org/wp-content/uploads/2018/06/Circle-of-Blue-Water-Speaks-600x139.png
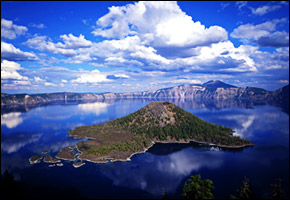
Cody Pope2009-07-31 21:42:482015-02-12 11:23:27Infographic: Top 10 Deepest Freshwater Lakes in the World
 https://www.circleofblue.org/wp-content/uploads/2009/07/10thingsknow.jpg
200
290
Cody Pope
https://www.circleofblue.org/wp-content/uploads/2018/06/Circle-of-Blue-Water-Speaks-600x139.png
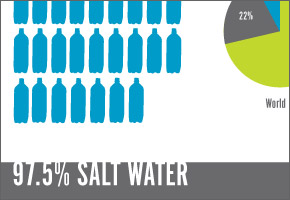
Cody Pope2009-07-24 18:59:232013-01-12 15:02:49Infographic: 10 Things You Should Know About Water


