Posts
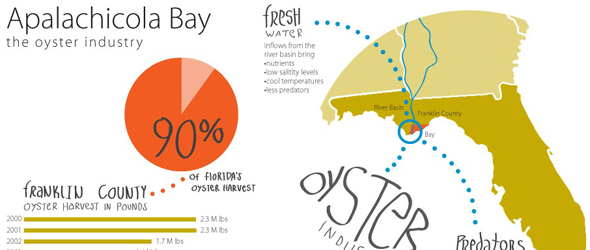
Infographic: The Oyster Industry in Florida’s Apalachicola Bay
3 Comments
/
How do freshwater flows — or lack thereof — affect the marine life downstream?
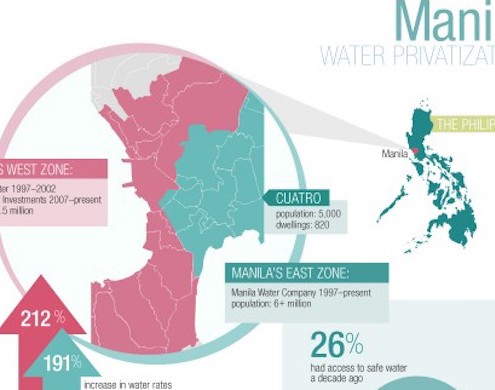
Infographic: Water Privatization in the Philippines
Breaking down the history of water privatization in the Philipine capital of Manila, this infographic explores the city's varied success with privatization using a timeline and a map.
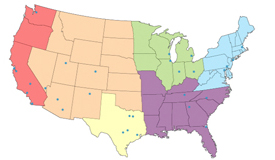
Map: 2012 Water Prices in 30 Major U.S. Cities
The price that Americans pay for water is rising faster than the cost of any other utility service in the United States — be it gas, electricity, or telephone charges.
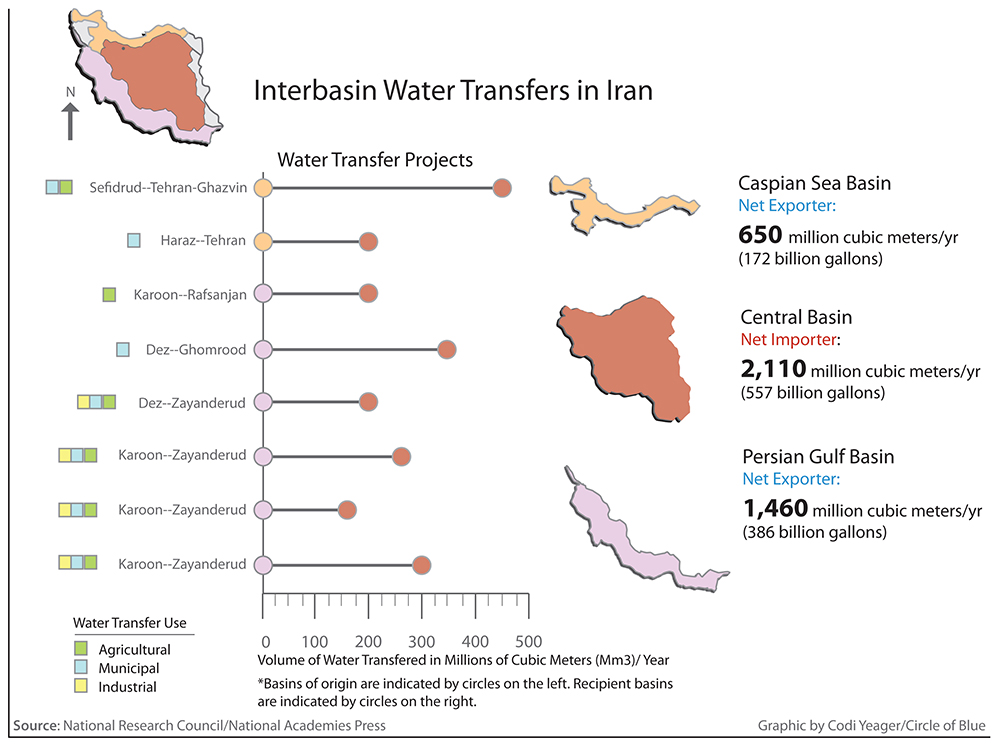
Map: Interbasin Water Transfers in Iran
The country already has major water transfer projects moving 2,110 million cubic meters (557 billion gallons). Just two weeks ago, Iran began construction on a new $US 1.5 billion project that will transfer more water from the Caspian Sea.
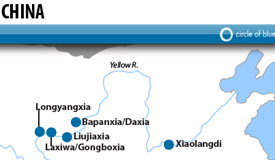
Map: Major Hydropower in China
China is pushing its renewable energy agenda by investing in hydropower. By 2015, the Chinese government expects that its installed capacity from hydropower will amount to 300,000 megawatts, thus reducing the nation's reliance on fossil fuels.
The Stream, December 26: Energy Use Across Europe
By 2100, global climate change will shift nearly 40 percent of…
Infographic: Unprescribed — Drugs in the Water Cycle
In 2009, 3.9 billion prescriptions were dispensed in the United States, and an estimated 10 to 40 percent of medicines are not used. With 78 million baby boomers reaching the age when prescription drug use will increase, how will this affect environmental and drinking water?
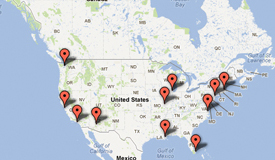
Interactive Map: U.S. Cities Acting Now to Reduce Water Risk from Climate Change
A report from the Natural Resources Defense Council describes water threats and adaptations in a dozen American cities.
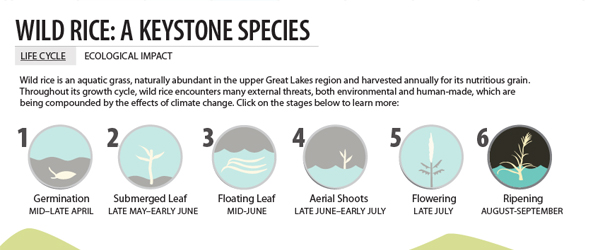
Infographic: Wild Rice is Keystone Species for Upper Great Lakes Region
Wild Rice is an aquatic grass that is harvested annually for…
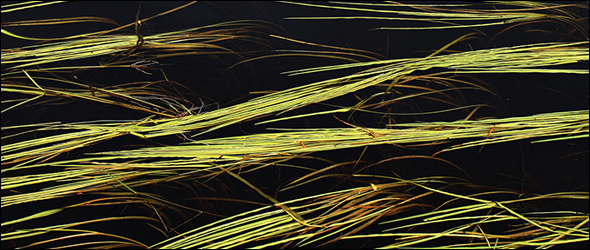
Where Food Grows on Water: Environmental and Human Threats to Wisconsin’s Wild Rice
For generations, the upper Great Lakes region has boasted harvests of wild rice, growing in Lake Superior and other watersheds within the basin. But disease, dams, and climate change are now endangering the uncultivated bounty.
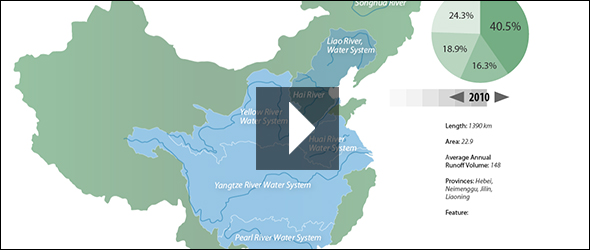
Infographic: Map of Pollution Levels in China’s Major River Basins
The seven major river basins, as a whole, have had steady improvements in water quality over the past decade.

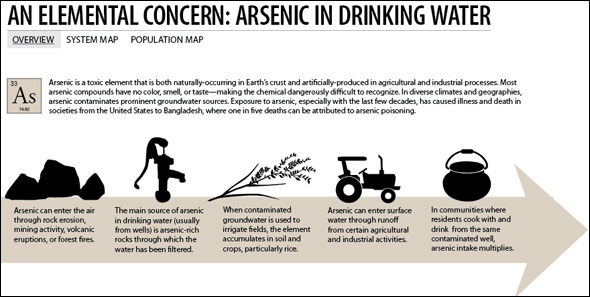
Infographic: An Elemental Concern—Arsenic in Drinking Water
Arsenic is both naturally occurring and artificially produced, and the toxin is very dangerous since it often has no color, taste, or smell. This graphic breaks down how arsenic gets into drinking water supplies and how arsenic affects the U.S. on the state level.


