
Posts
 https://www.circleofblue.org/wp-content/uploads/2015/05/info-thumb.jpg
525
525
Kaye LaFond
https://www.circleofblue.org/wp-content/uploads/2018/06/Circle-of-Blue-Water-Speaks-600x139.png
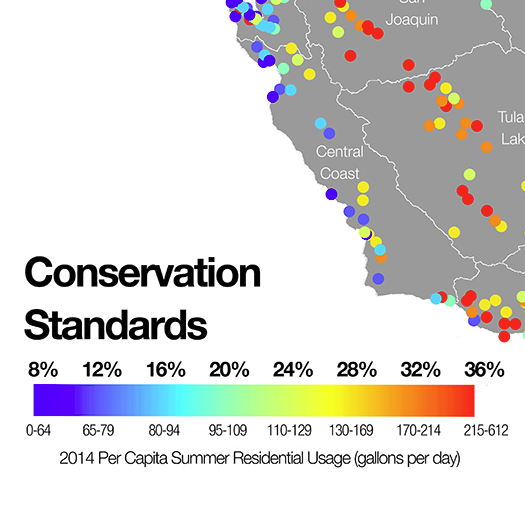
Kaye LaFond2015-05-19 12:13:522016-04-12 15:37:34Infographic: California Urban Water Conservation Standards
https://www.circleofblue.org/wp-content/uploads/2015/05/info-thumb.jpg
525
525
Kaye LaFond
https://www.circleofblue.org/wp-content/uploads/2018/06/Circle-of-Blue-Water-Speaks-600x139.png
Kaye LaFond2015-05-19 12:13:522016-04-12 15:37:34Infographic: California Urban Water Conservation Standards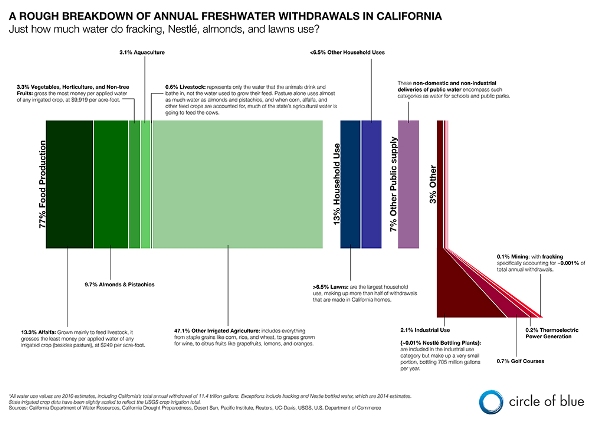 https://www.circleofblue.org/wp-content/uploads/2015/05/CaliforniaWaterUse590.jpg
423
590
Kaye LaFond
https://www.circleofblue.org/wp-content/uploads/2018/06/Circle-of-Blue-Water-Speaks-600x139.png
Kaye LaFond2015-05-14 13:04:332016-04-12 15:32:02Infographic: California Freshwater Withdrawals
https://www.circleofblue.org/wp-content/uploads/2015/05/CaliforniaWaterUse590.jpg
423
590
Kaye LaFond
https://www.circleofblue.org/wp-content/uploads/2018/06/Circle-of-Blue-Water-Speaks-600x139.png
Kaye LaFond2015-05-14 13:04:332016-04-12 15:32:02Infographic: California Freshwater Withdrawals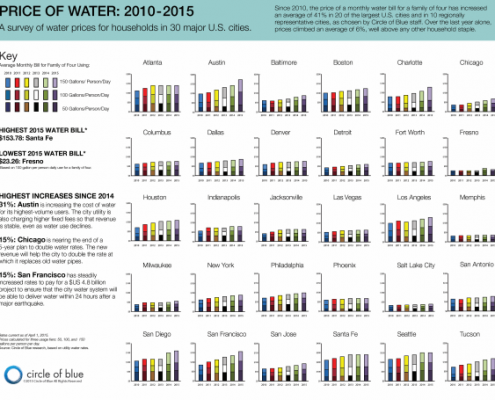 https://www.circleofblue.org/wp-content/uploads/2015/04/Screen-Shot-2016-01-04-at-1.23.58-PM.png
455
580
Kaye LaFond
https://www.circleofblue.org/wp-content/uploads/2018/06/Circle-of-Blue-Water-Speaks-600x139.png
Kaye LaFond2015-04-24 15:09:182016-10-17 14:15:14Infographic: Price of Water in 30 Major U.S. Cities (2010-2015)
https://www.circleofblue.org/wp-content/uploads/2015/04/Screen-Shot-2016-01-04-at-1.23.58-PM.png
455
580
Kaye LaFond
https://www.circleofblue.org/wp-content/uploads/2018/06/Circle-of-Blue-Water-Speaks-600x139.png
Kaye LaFond2015-04-24 15:09:182016-10-17 14:15:14Infographic: Price of Water in 30 Major U.S. Cities (2010-2015)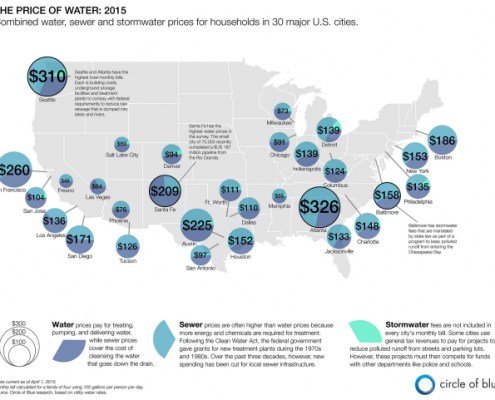 https://www.circleofblue.org/wp-content/uploads/2015/04/Screen-Shot-2016-01-04-at-1.27.32-PM.png
481
633
Kaye LaFond
https://www.circleofblue.org/wp-content/uploads/2018/06/Circle-of-Blue-Water-Speaks-600x139.png
Kaye LaFond2015-04-24 14:10:332016-10-14 10:01:50Infographic: 2015 Price of U.S. Water, Sewer, and Stormwater
https://www.circleofblue.org/wp-content/uploads/2015/04/Screen-Shot-2016-01-04-at-1.27.32-PM.png
481
633
Kaye LaFond
https://www.circleofblue.org/wp-content/uploads/2018/06/Circle-of-Blue-Water-Speaks-600x139.png
Kaye LaFond2015-04-24 14:10:332016-10-14 10:01:50Infographic: 2015 Price of U.S. Water, Sewer, and Stormwater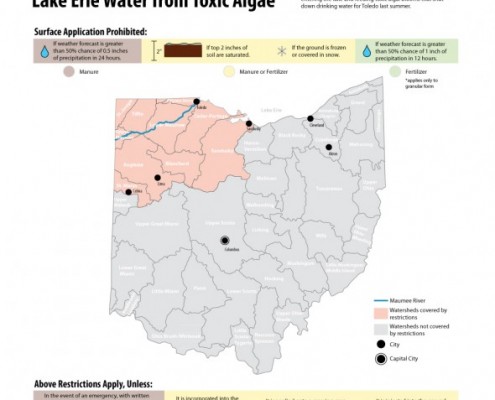 https://www.circleofblue.org/wp-content/uploads/2015/04/OhioFertilizerLawFinal-590x590-1.jpg
590
590
Codi Kozacek
https://www.circleofblue.org/wp-content/uploads/2018/06/Circle-of-Blue-Water-Speaks-600x139.png
Codi Kozacek2015-04-23 16:19:562016-03-14 11:40:05Infographic: Ohio Passes Farm Regulations to Stop Lake Erie Toxic Algae
https://www.circleofblue.org/wp-content/uploads/2015/04/OhioFertilizerLawFinal-590x590-1.jpg
590
590
Codi Kozacek
https://www.circleofblue.org/wp-content/uploads/2018/06/Circle-of-Blue-Water-Speaks-600x139.png
Codi Kozacek2015-04-23 16:19:562016-03-14 11:40:05Infographic: Ohio Passes Farm Regulations to Stop Lake Erie Toxic Algae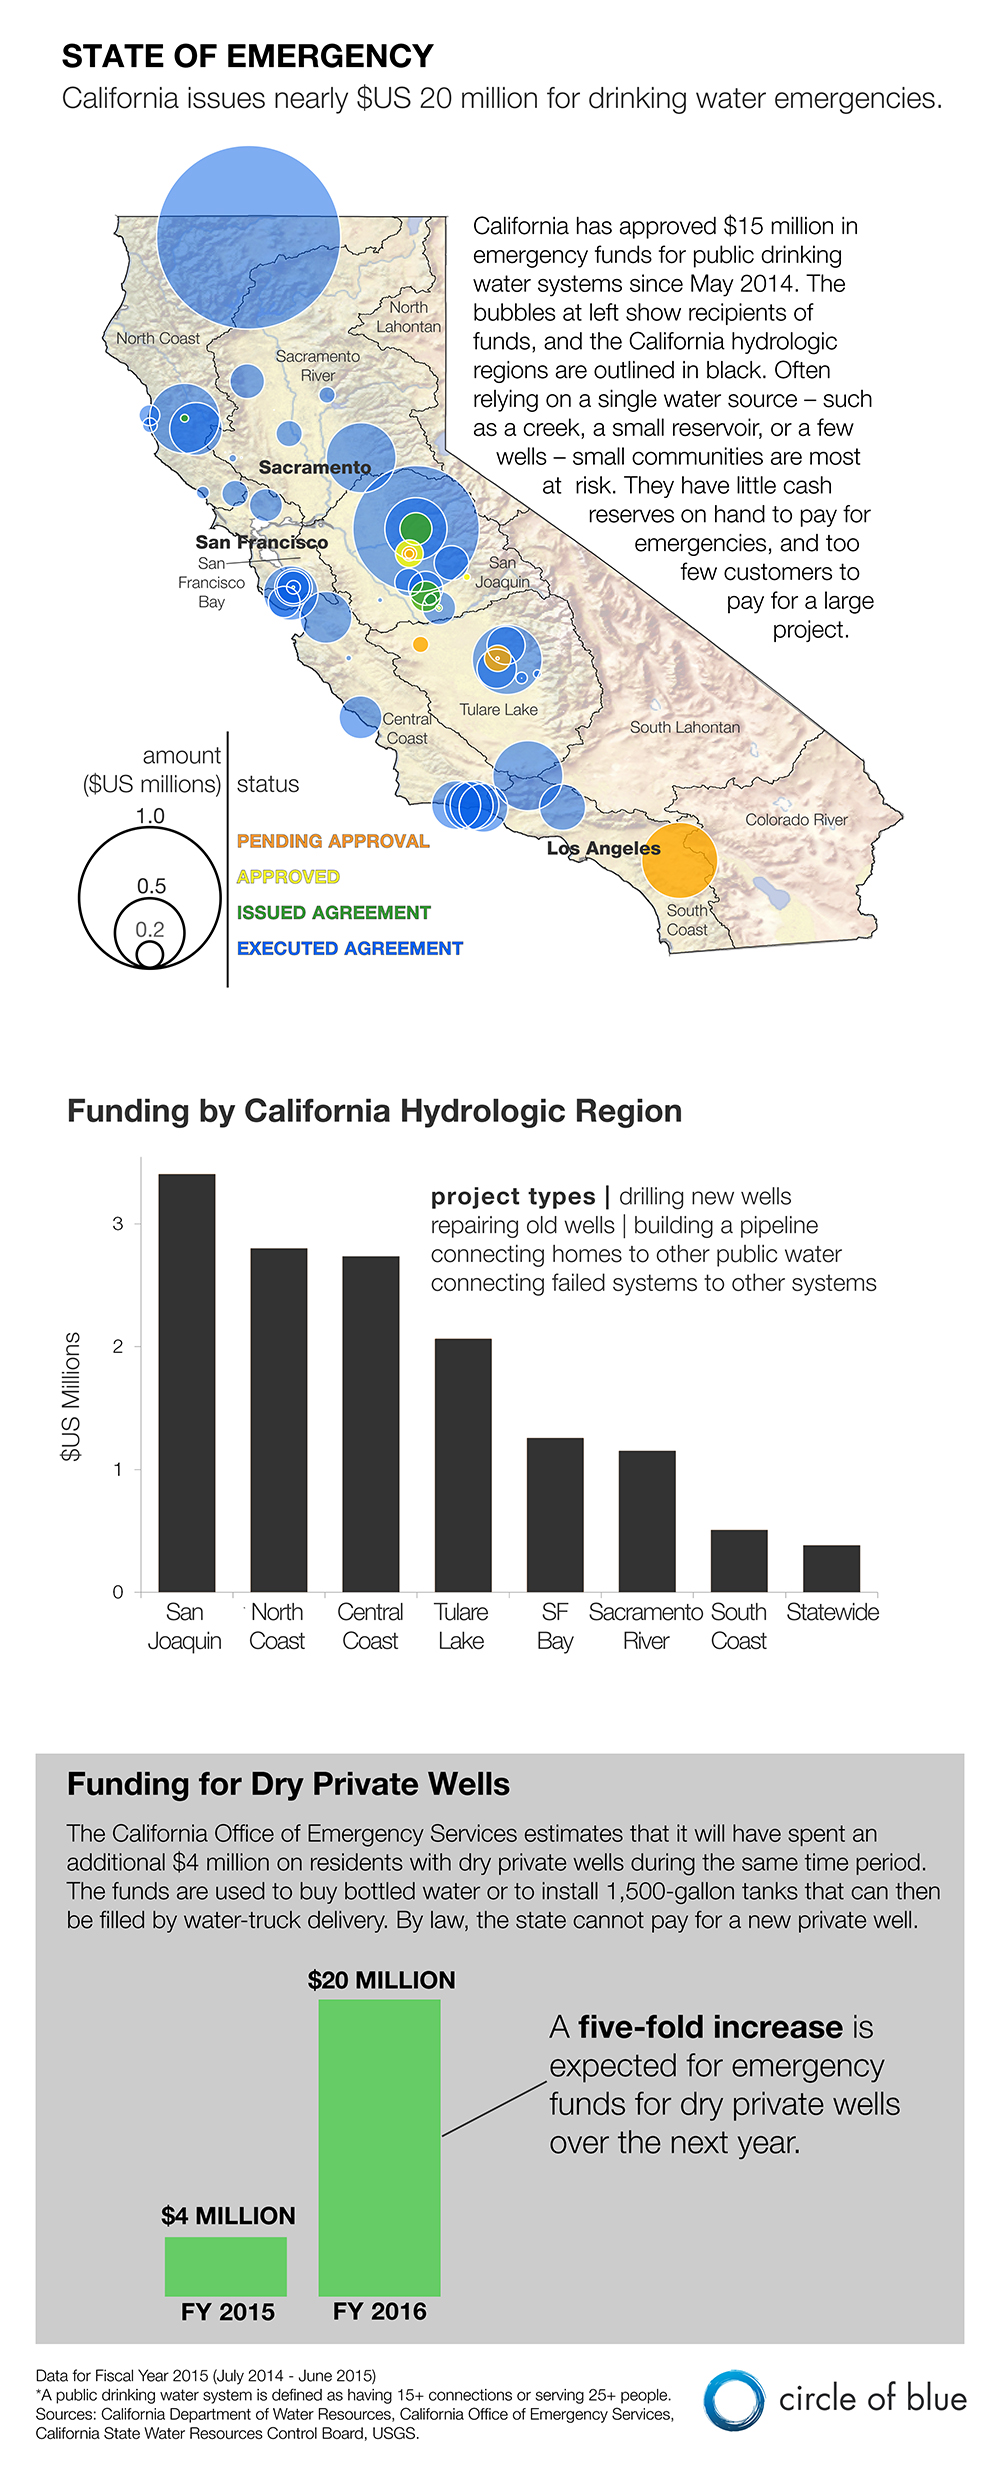 https://www.circleofblue.org/wp-content/uploads/2015/04/emergencywater-3.jpg
2476
1000
Kaye LaFond
https://www.circleofblue.org/wp-content/uploads/2018/06/Circle-of-Blue-Water-Speaks-600x139.png
Kaye LaFond2015-04-17 06:00:002016-04-12 15:36:22Infographic: Emergency Water Funds for California Communities (May 2014-July 2015)
https://www.circleofblue.org/wp-content/uploads/2015/04/emergencywater-3.jpg
2476
1000
Kaye LaFond
https://www.circleofblue.org/wp-content/uploads/2018/06/Circle-of-Blue-Water-Speaks-600x139.png
Kaye LaFond2015-04-17 06:00:002016-04-12 15:36:22Infographic: Emergency Water Funds for California Communities (May 2014-July 2015)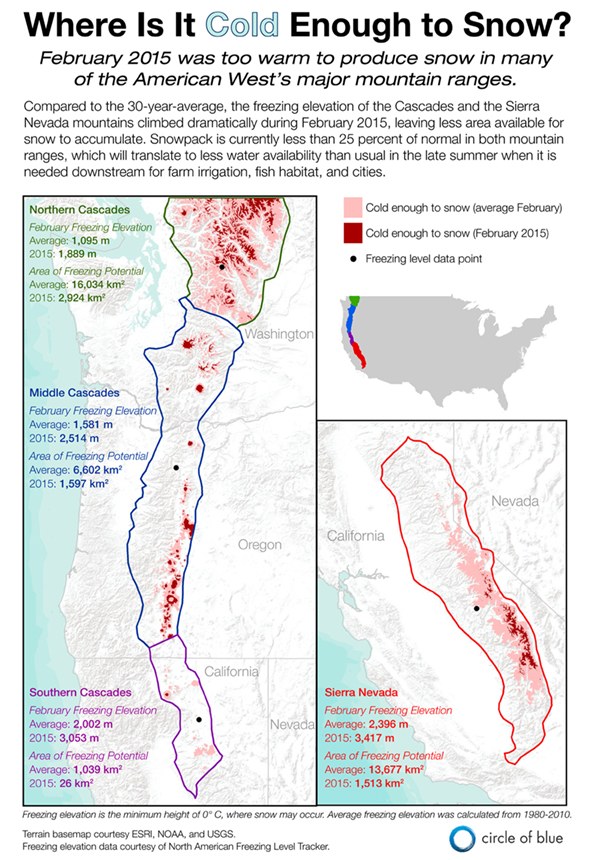 https://www.circleofblue.org/wp-content/uploads/2015/03/snowfallfeatured.jpg
860
590
Kaye LaFond
https://www.circleofblue.org/wp-content/uploads/2018/06/Circle-of-Blue-Water-Speaks-600x139.png
Kaye LaFond2015-03-03 14:25:332016-03-31 11:14:07Infographic: Too Warm to Snow in California, Oregon, and Washington
https://www.circleofblue.org/wp-content/uploads/2015/03/snowfallfeatured.jpg
860
590
Kaye LaFond
https://www.circleofblue.org/wp-content/uploads/2018/06/Circle-of-Blue-Water-Speaks-600x139.png
Kaye LaFond2015-03-03 14:25:332016-03-31 11:14:07Infographic: Too Warm to Snow in California, Oregon, and Washington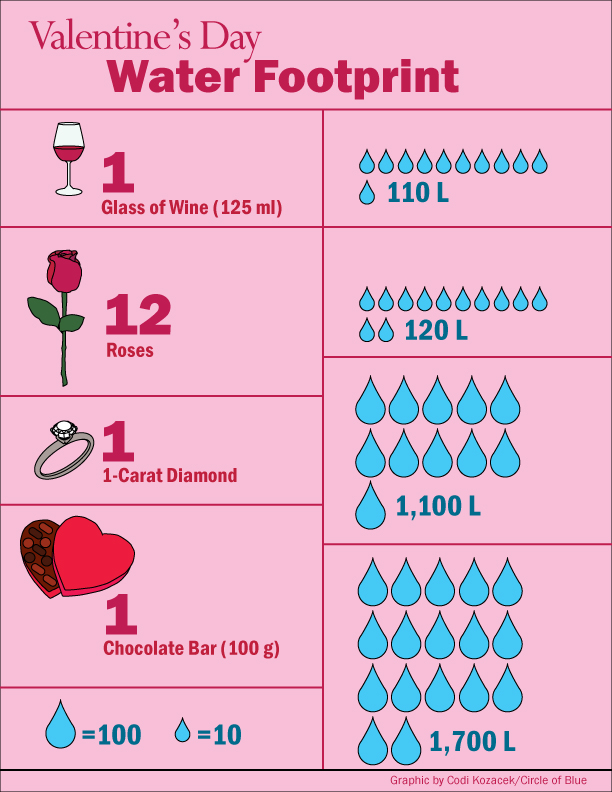 https://www.circleofblue.org/wp-content/uploads/2015/02/VDay.jpg
792
612
Codi Kozacek
https://www.circleofblue.org/wp-content/uploads/2018/06/Circle-of-Blue-Water-Speaks-600x139.png
Codi Kozacek2015-02-14 13:37:552016-03-14 11:46:54Infographic: Water Footprint of Valentine’s Day
https://www.circleofblue.org/wp-content/uploads/2015/02/VDay.jpg
792
612
Codi Kozacek
https://www.circleofblue.org/wp-content/uploads/2018/06/Circle-of-Blue-Water-Speaks-600x139.png
Codi Kozacek2015-02-14 13:37:552016-03-14 11:46:54Infographic: Water Footprint of Valentine’s Day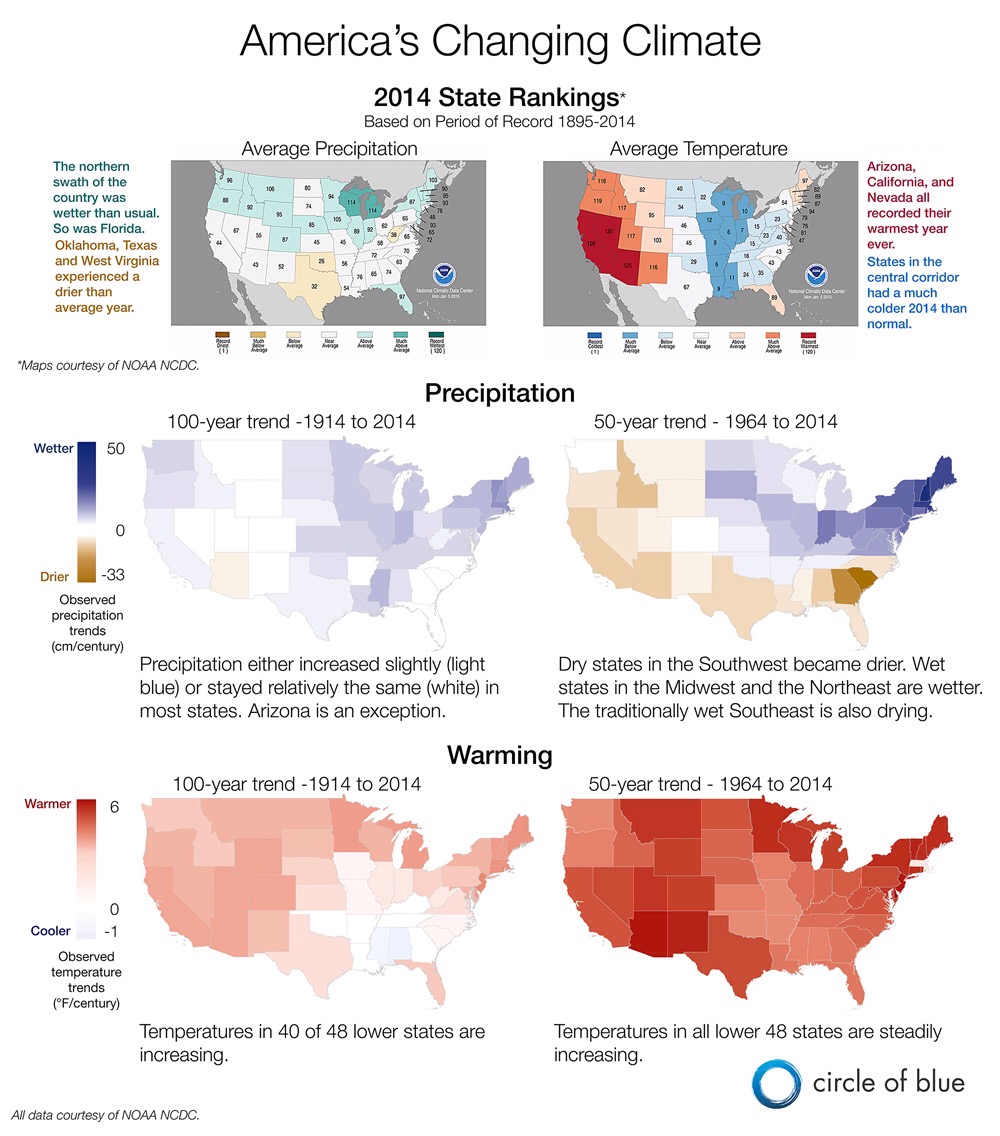 https://www.circleofblue.org/wp-content/uploads/2015/01/IMG_3869.jpg
1136
1000
Kaye LaFond
https://www.circleofblue.org/wp-content/uploads/2018/06/Circle-of-Blue-Water-Speaks-600x139.png
Kaye LaFond2015-01-28 09:40:072016-03-14 11:48:43Infographic: The Drier, Wetter, Warming U.S.
https://www.circleofblue.org/wp-content/uploads/2015/01/IMG_3869.jpg
1136
1000
Kaye LaFond
https://www.circleofblue.org/wp-content/uploads/2018/06/Circle-of-Blue-Water-Speaks-600x139.png
Kaye LaFond2015-01-28 09:40:072016-03-14 11:48:43Infographic: The Drier, Wetter, Warming U.S.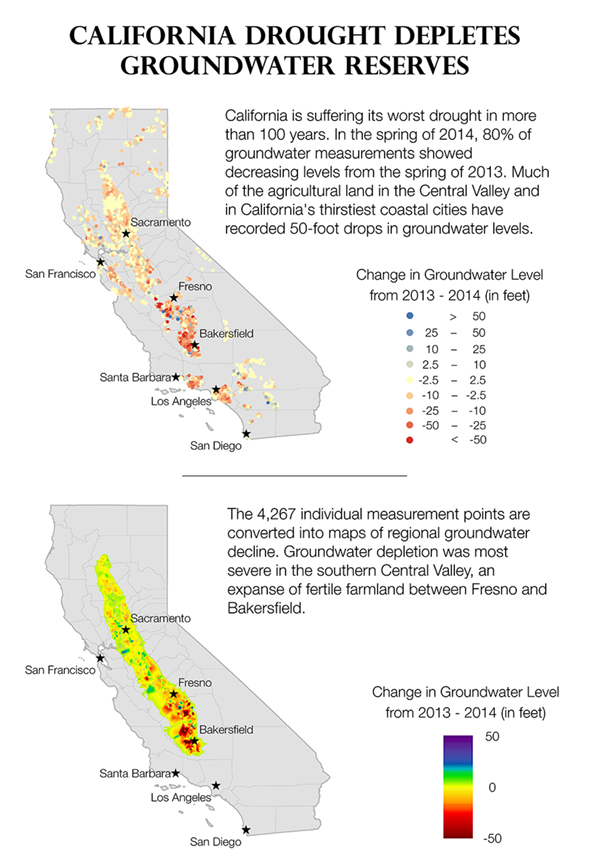 https://www.circleofblue.org/wp-content/uploads/2014/12/cagwfeatured.jpg
863
590
Kaye LaFond
https://www.circleofblue.org/wp-content/uploads/2018/06/Circle-of-Blue-Water-Speaks-600x139.png
Kaye LaFond2014-12-18 15:26:152016-04-12 15:40:48Infographic: California Drought Drains Groundwater Reserves and Encourages New Wells
https://www.circleofblue.org/wp-content/uploads/2014/12/cagwfeatured.jpg
863
590
Kaye LaFond
https://www.circleofblue.org/wp-content/uploads/2018/06/Circle-of-Blue-Water-Speaks-600x139.png
Kaye LaFond2014-12-18 15:26:152016-04-12 15:40:48Infographic: California Drought Drains Groundwater Reserves and Encourages New Wells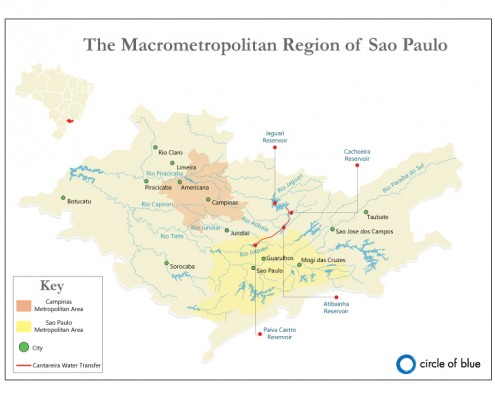 https://www.circleofblue.org/wp-content/uploads/2015/05/SaoPauloMetroMapWeb.jpg
612
792
Codi Kozacek
https://www.circleofblue.org/wp-content/uploads/2018/06/Circle-of-Blue-Water-Speaks-600x139.png
Codi Kozacek2014-12-16 14:29:362016-08-16 15:09:07Map: Sao Paulo Water Supply Systems
https://www.circleofblue.org/wp-content/uploads/2015/05/SaoPauloMetroMapWeb.jpg
612
792
Codi Kozacek
https://www.circleofblue.org/wp-content/uploads/2018/06/Circle-of-Blue-Water-Speaks-600x139.png
Codi Kozacek2014-12-16 14:29:362016-08-16 15:09:07Map: Sao Paulo Water Supply Systems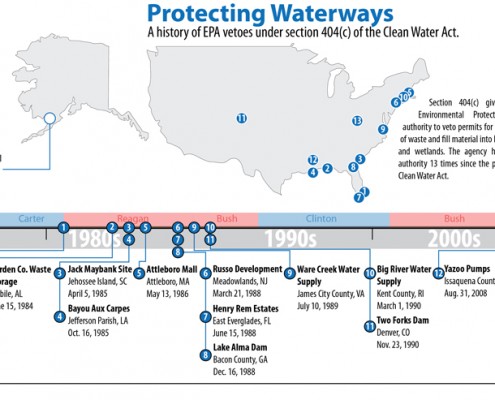 https://www.circleofblue.org/wp-content/uploads/2012/07/404CTimelineSmall-1.jpg
493
1000
Codi Kozacek
https://www.circleofblue.org/wp-content/uploads/2018/06/Circle-of-Blue-Water-Speaks-600x139.png
Codi Kozacek2014-12-15 19:45:552016-03-14 11:54:03Infographic: A History of EPA Veto Actions to Protect Water
https://www.circleofblue.org/wp-content/uploads/2012/07/404CTimelineSmall-1.jpg
493
1000
Codi Kozacek
https://www.circleofblue.org/wp-content/uploads/2018/06/Circle-of-Blue-Water-Speaks-600x139.png
Codi Kozacek2014-12-15 19:45:552016-03-14 11:54:03Infographic: A History of EPA Veto Actions to Protect Water

