
Posts
 https://www.circleofblue.org/wp-content/uploads/2013/08/MesMarsh-banner.jpg
261
590
Kalin Wood
https://www.circleofblue.org/wp-content/uploads/2018/06/Circle-of-Blue-Water-Speaks-600x139.png
Kalin Wood2013-09-04 11:36:232013-10-21 13:09:06Map: Destruction and Restoration of Iraq’s Mesopotamian Marshlands (1973-2013)
https://www.circleofblue.org/wp-content/uploads/2013/08/MesMarsh-banner.jpg
261
590
Kalin Wood
https://www.circleofblue.org/wp-content/uploads/2018/06/Circle-of-Blue-Water-Speaks-600x139.png
Kalin Wood2013-09-04 11:36:232013-10-21 13:09:06Map: Destruction and Restoration of Iraq’s Mesopotamian Marshlands (1973-2013)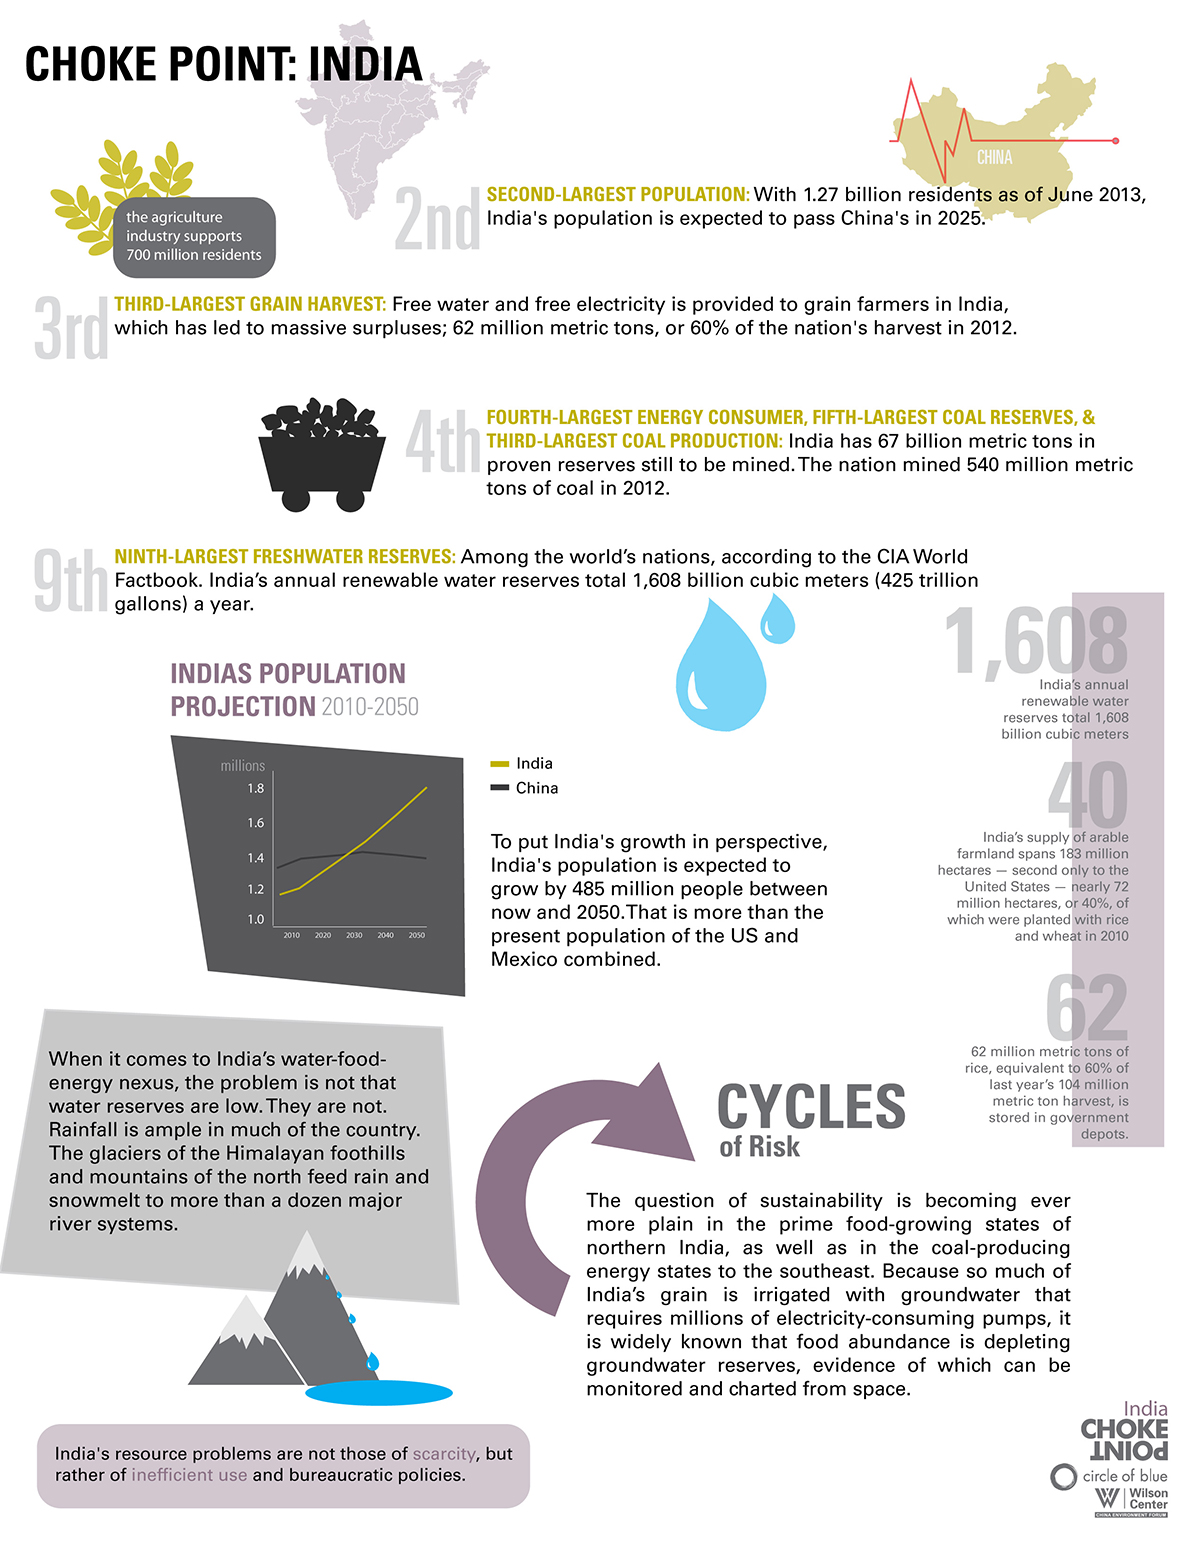 https://www.circleofblue.org/wp-content/uploads/2013/08/choke-point-india-graphic.jpg
1553
1200
Laura Stegmeyer
https://www.circleofblue.org/wp-content/uploads/2018/06/Circle-of-Blue-Water-Speaks-600x139.png
Laura Stegmeyer2013-06-11 22:45:112015-12-11 14:45:44Infographic: Water, Food, and Energy Choke Points in India
https://www.circleofblue.org/wp-content/uploads/2013/08/choke-point-india-graphic.jpg
1553
1200
Laura Stegmeyer
https://www.circleofblue.org/wp-content/uploads/2018/06/Circle-of-Blue-Water-Speaks-600x139.png
Laura Stegmeyer2013-06-11 22:45:112015-12-11 14:45:44Infographic: Water, Food, and Energy Choke Points in India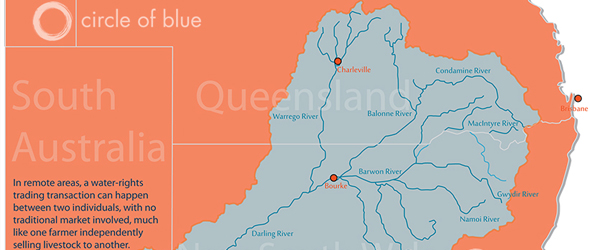 https://www.circleofblue.org/wp-content/uploads/2013/02/australia-water-trading.jpg
250
590
Codi Kozacek
https://www.circleofblue.org/wp-content/uploads/2018/06/Circle-of-Blue-Water-Speaks-600x139.png
Codi Kozacek2013-02-21 14:35:222016-02-18 15:08:39Map: 30 Years of Trading Water in Australia
https://www.circleofblue.org/wp-content/uploads/2013/02/australia-water-trading.jpg
250
590
Codi Kozacek
https://www.circleofblue.org/wp-content/uploads/2018/06/Circle-of-Blue-Water-Speaks-600x139.png
Codi Kozacek2013-02-21 14:35:222016-02-18 15:08:39Map: 30 Years of Trading Water in Australia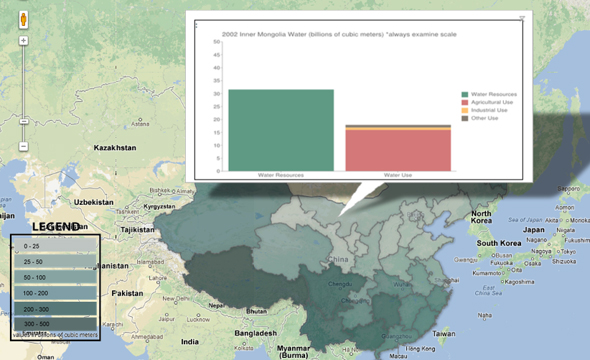 https://www.circleofblue.org/wp-content/uploads/2012/12/China-Water-Resources.jpg
360
590
Circle of Blue
https://www.circleofblue.org/wp-content/uploads/2018/06/Circle-of-Blue-Water-Speaks-600x139.png
Circle of Blue2013-02-19 13:57:332015-12-10 13:35:51Map: China’s Provincial Water Resources and Use (2002-2010)
https://www.circleofblue.org/wp-content/uploads/2012/12/China-Water-Resources.jpg
360
590
Circle of Blue
https://www.circleofblue.org/wp-content/uploads/2018/06/Circle-of-Blue-Water-Speaks-600x139.png
Circle of Blue2013-02-19 13:57:332015-12-10 13:35:51Map: China’s Provincial Water Resources and Use (2002-2010)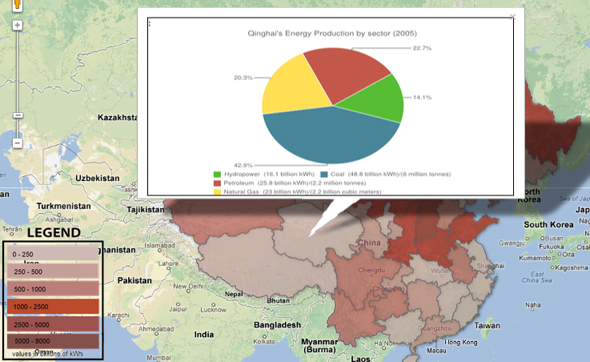 https://www.circleofblue.org/wp-content/uploads/2012/12/China-Energy-Production.jpg
362
590
Circle of Blue
https://www.circleofblue.org/wp-content/uploads/2018/06/Circle-of-Blue-Water-Speaks-600x139.png
Circle of Blue2013-01-31 16:38:422015-12-10 13:39:07Map: China’s Provincial Energy Production (1997-2010)
https://www.circleofblue.org/wp-content/uploads/2012/12/China-Energy-Production.jpg
362
590
Circle of Blue
https://www.circleofblue.org/wp-content/uploads/2018/06/Circle-of-Blue-Water-Speaks-600x139.png
Circle of Blue2013-01-31 16:38:422015-12-10 13:39:07Map: China’s Provincial Energy Production (1997-2010)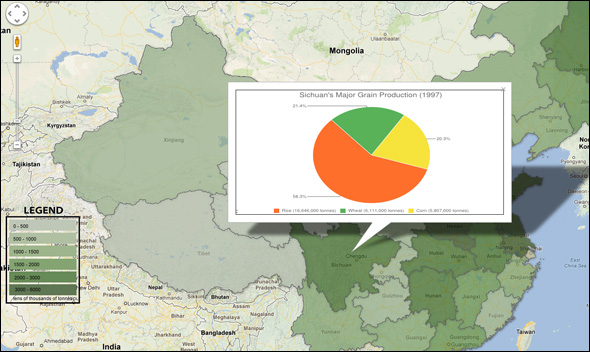 https://www.circleofblue.org/wp-content/uploads/2012/11/china-grain-thumbnail-590px.jpg
352
590
Circle of Blue
https://www.circleofblue.org/wp-content/uploads/2018/06/Circle-of-Blue-Water-Speaks-600x139.png
Circle of Blue2012-12-12 21:25:032015-12-10 13:38:56Map: China’s Provincial Grain Production (1997-2010)
https://www.circleofblue.org/wp-content/uploads/2012/11/china-grain-thumbnail-590px.jpg
352
590
Circle of Blue
https://www.circleofblue.org/wp-content/uploads/2018/06/Circle-of-Blue-Water-Speaks-600x139.png
Circle of Blue2012-12-12 21:25:032015-12-10 13:38:56Map: China’s Provincial Grain Production (1997-2010)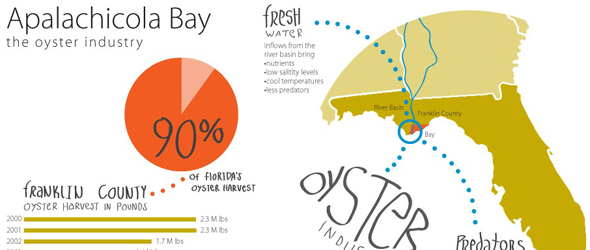 https://www.circleofblue.org/wp-content/uploads/2012/09/apalachicola-bay-590x250.jpg
250
590
Circle of Blue
https://www.circleofblue.org/wp-content/uploads/2018/06/Circle-of-Blue-Water-Speaks-600x139.png
Circle of Blue2012-09-24 10:43:172016-03-10 12:30:33Infographic: The Oyster Industry in Florida’s Apalachicola Bay
https://www.circleofblue.org/wp-content/uploads/2012/09/apalachicola-bay-590x250.jpg
250
590
Circle of Blue
https://www.circleofblue.org/wp-content/uploads/2018/06/Circle-of-Blue-Water-Speaks-600x139.png
Circle of Blue2012-09-24 10:43:172016-03-10 12:30:33Infographic: The Oyster Industry in Florida’s Apalachicola Bay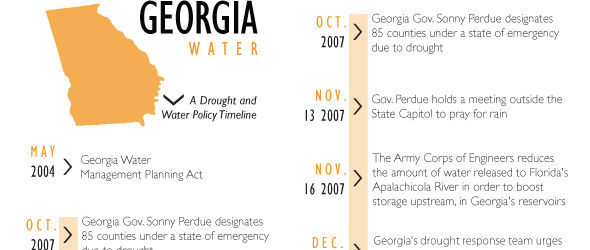 https://www.circleofblue.org/wp-content/uploads/2012/09/georgia-water-timeline.jpg
250
590
Circle of Blue
https://www.circleofblue.org/wp-content/uploads/2018/06/Circle-of-Blue-Water-Speaks-600x139.png
Circle of Blue2012-09-18 14:29:192016-03-10 13:58:09Infographic: A Drought and Water Policy Timeline for Georgia
https://www.circleofblue.org/wp-content/uploads/2012/09/georgia-water-timeline.jpg
250
590
Circle of Blue
https://www.circleofblue.org/wp-content/uploads/2018/06/Circle-of-Blue-Water-Speaks-600x139.png
Circle of Blue2012-09-18 14:29:192016-03-10 13:58:09Infographic: A Drought and Water Policy Timeline for Georgia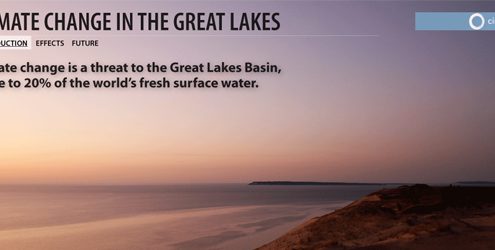 https://www.circleofblue.org/wp-content/uploads/2012/08/climate-change-featured-1.jpg
250
590
Circle of Blue
https://www.circleofblue.org/wp-content/uploads/2018/06/Circle-of-Blue-Water-Speaks-600x139.png
Circle of Blue2012-08-31 16:18:592016-06-21 15:37:40Infographic: Climate Change in the Great Lakes
https://www.circleofblue.org/wp-content/uploads/2012/08/climate-change-featured-1.jpg
250
590
Circle of Blue
https://www.circleofblue.org/wp-content/uploads/2018/06/Circle-of-Blue-Water-Speaks-600x139.png
Circle of Blue2012-08-31 16:18:592016-06-21 15:37:40Infographic: Climate Change in the Great Lakes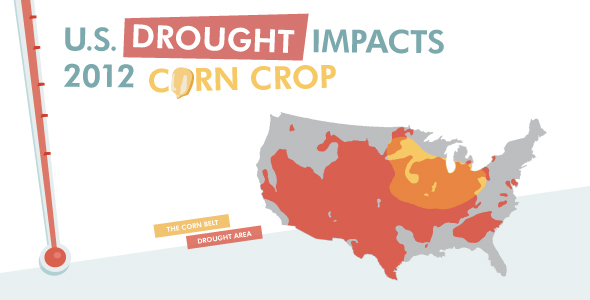 https://www.circleofblue.org/wp-content/uploads/2012/08/cornrotator-1.jpg
300
590
Circle of Blue
https://www.circleofblue.org/wp-content/uploads/2018/06/Circle-of-Blue-Water-Speaks-600x139.png
Circle of Blue2012-08-06 09:50:082016-03-10 12:27:38Infographic: Drought Slashes 2012 U.S. Corn Crop
https://www.circleofblue.org/wp-content/uploads/2012/08/cornrotator-1.jpg
300
590
Circle of Blue
https://www.circleofblue.org/wp-content/uploads/2018/06/Circle-of-Blue-Water-Speaks-600x139.png
Circle of Blue2012-08-06 09:50:082016-03-10 12:27:38Infographic: Drought Slashes 2012 U.S. Corn Crop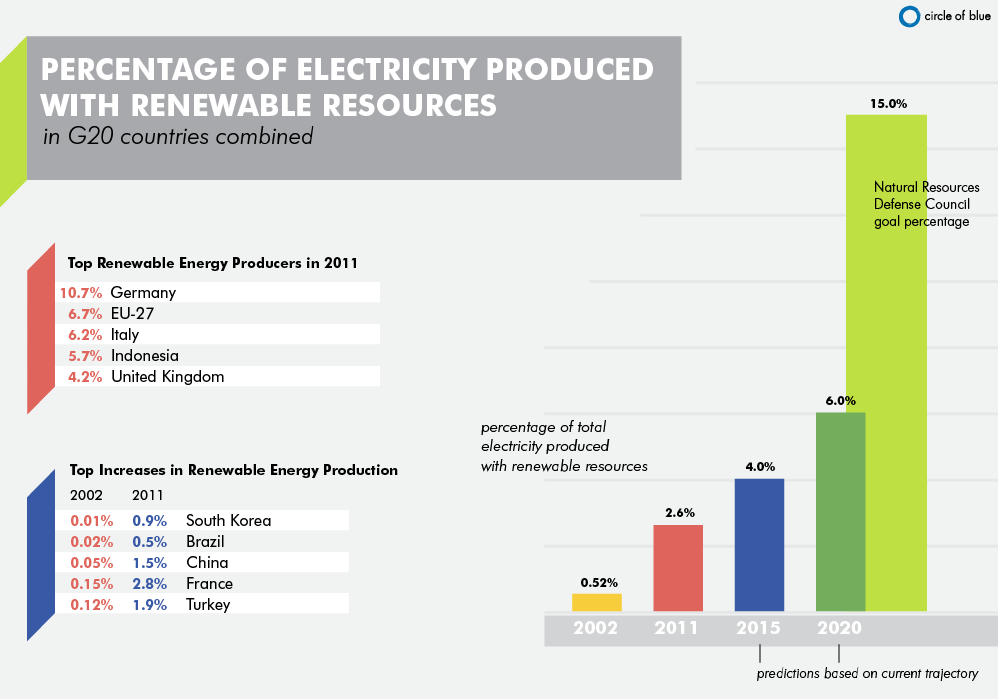 https://www.circleofblue.org/wp-content/uploads/2012/06/Percentage-of-Electricity-Produced-with-Renewable-Resources-in-G20-countries-combined.png
699
998
Circle of Blue
https://www.circleofblue.org/wp-content/uploads/2018/06/Circle-of-Blue-Water-Speaks-600x139.png
Circle of Blue2012-06-19 17:40:342012-06-19 17:44:21Infographic: G20 Renewable Energy from 2002 to 2020
https://www.circleofblue.org/wp-content/uploads/2012/06/Percentage-of-Electricity-Produced-with-Renewable-Resources-in-G20-countries-combined.png
699
998
Circle of Blue
https://www.circleofblue.org/wp-content/uploads/2018/06/Circle-of-Blue-Water-Speaks-600x139.png
Circle of Blue2012-06-19 17:40:342012-06-19 17:44:21Infographic: G20 Renewable Energy from 2002 to 2020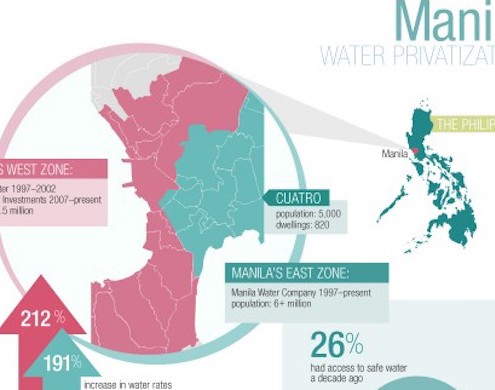 https://www.circleofblue.org/wp-content/uploads/2012/06/ManilaFinal1000px-500x700-2.jpg
390
600
Circle of Blue
https://www.circleofblue.org/wp-content/uploads/2018/06/Circle-of-Blue-Water-Speaks-600x139.png
Circle of Blue2012-06-07 06:00:112016-02-12 11:48:05Infographic: Water Privatization in the Philippines
https://www.circleofblue.org/wp-content/uploads/2012/06/ManilaFinal1000px-500x700-2.jpg
390
600
Circle of Blue
https://www.circleofblue.org/wp-content/uploads/2018/06/Circle-of-Blue-Water-Speaks-600x139.png
Circle of Blue2012-06-07 06:00:112016-02-12 11:48:05Infographic: Water Privatization in the Philippines

