Posts
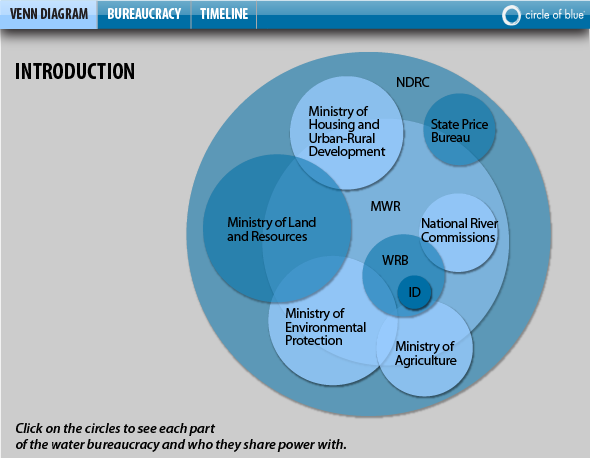
Infographic: China’s Water Governance Bureaucracy and Water Legislation Timeline
0 Comments
/
Demystifying China's governmental water offices and water-related…
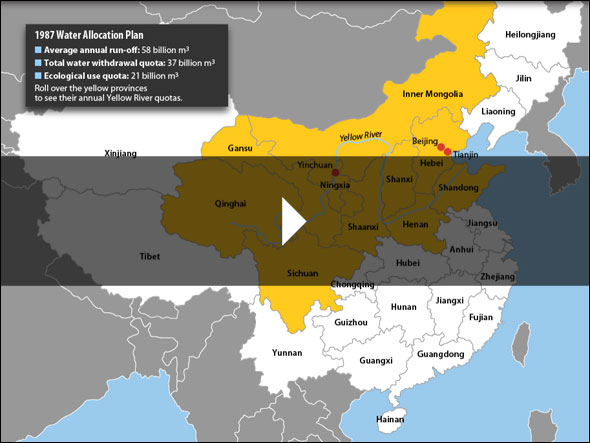
Infographic: Map of Water Allocations in China’s Yellow River Basin
Water allocations for the Yellow River Basin's nine provinces.
A…
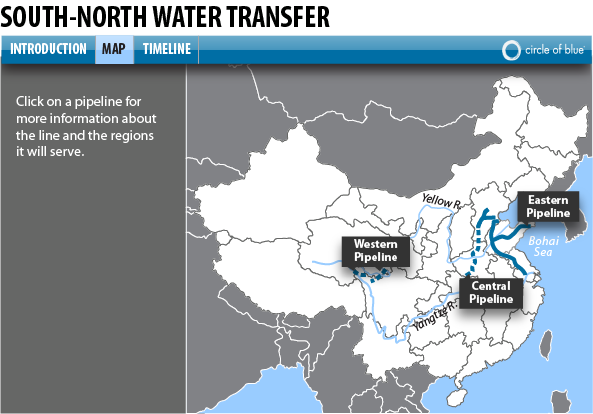
Infographic: China’s South-North Water Transfer Project
Authorities close to the central government say the western line will be built.
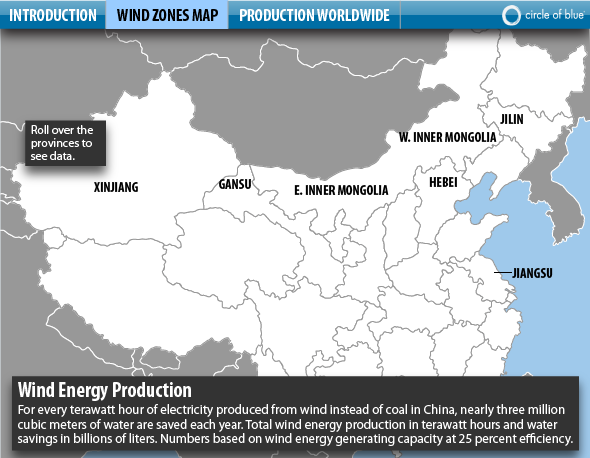
Infographic: China’s Wind Energy Sector is Global Leader
Wind generating capacity in China has reached more than 42 GW—the most of any country.
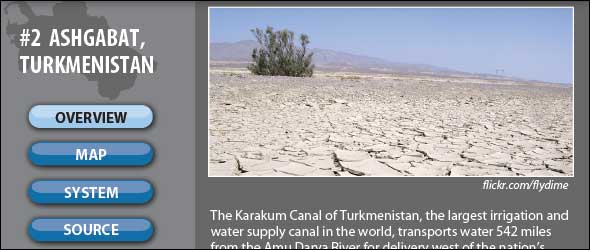
Infographic: Going the Distance, From Ashgabat to Whyalla—10 Cities Pumping Water From Afar
In many cities, water travels far to reach the tap. Residents of the planet's driest places rely on extensive waterways to deliver their supply. Click through the interactive infographic below to learn more about 10 cities that pipe water in from distant aquifers, plus additional plans to expand waterway networks even further.
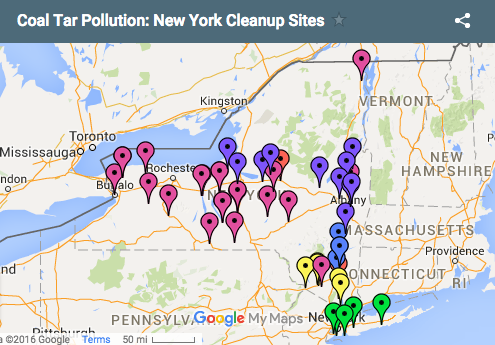
Water Pollution Solution — New York Experiments with Coal Tar “Sponges” in Hudson River
Testing new methods to remove residual coal tar from riverbeds in New York.
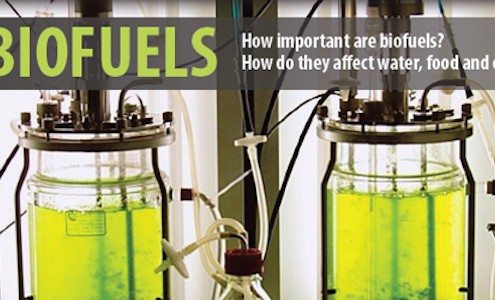
Infographic: Biofuels 101 — Water Use from Plant to Power Source
Production of ethanol, the most commonly used biofuel, has prompted concerns about water use and food supply.
Cholera in Haiti — The Climate Connection
Researchers explain the correlation between environmental interactions and human health, as reported infections climb to 10,000 cases.
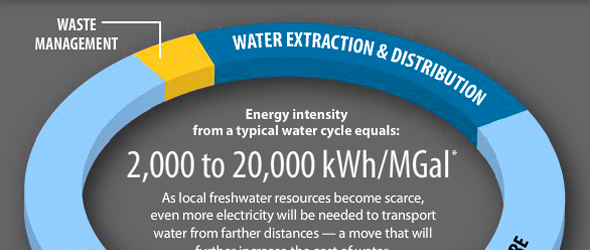
Infographic: Energy Used in the Water Cycle
At eight pounds per gallon, water is a heavy substance; especially when utilities move billions of gallons per day.

Infographic: Water and Energy
The emerging collision between the diminishing water supplies and the rising energy demand across the sectors of the U.S. economy.
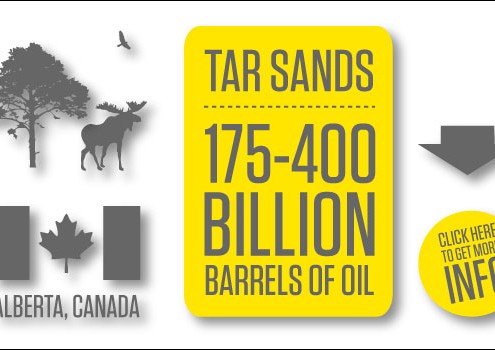
Infographic: A Closer Look at Tar Sands Oil
185 gallons of water + two tons of soil + 700-1200 cubic feet of natural gas
= one barrel of crude oil.
 https://www.circleofblue.org/wp-content/uploads/2010/09/Screen-Shot-2016-01-07-at-11.46.28-AM.png
418
575
Circle of Blue
https://www.circleofblue.org/wp-content/uploads/2018/06/Circle-of-Blue-Water-Speaks-600x139.png
Circle of Blue2010-09-22 04:42:142016-01-05 07:08:29Infographic: U.S. Power Sources

