
Posts
 https://www.circleofblue.org/wp-content/uploads/2010/09/water-energy-70.jpg
70
70
Circle of Blue
https://www.circleofblue.org/wp-content/uploads/2018/06/Circle-of-Blue-Water-Speaks-600x139.png
Circle of Blue2010-09-22 04:38:462015-11-24 13:05:39Infographic: State Legislatures Bridge Water-Energy Gap
https://www.circleofblue.org/wp-content/uploads/2010/09/water-energy-70.jpg
70
70
Circle of Blue
https://www.circleofblue.org/wp-content/uploads/2018/06/Circle-of-Blue-Water-Speaks-600x139.png
Circle of Blue2010-09-22 04:38:462015-11-24 13:05:39Infographic: State Legislatures Bridge Water-Energy Gap https://www.circleofblue.org/wp-content/uploads/2010/09/10thing-70.jpg
70
70
Circle of Blue
https://www.circleofblue.org/wp-content/uploads/2018/06/Circle-of-Blue-Water-Speaks-600x139.png
Circle of Blue2010-09-22 04:34:532015-11-24 13:03:58Infographic: 10 Things You Should Know about Water + Energy
https://www.circleofblue.org/wp-content/uploads/2010/09/10thing-70.jpg
70
70
Circle of Blue
https://www.circleofblue.org/wp-content/uploads/2018/06/Circle-of-Blue-Water-Speaks-600x139.png
Circle of Blue2010-09-22 04:34:532015-11-24 13:03:58Infographic: 10 Things You Should Know about Water + Energy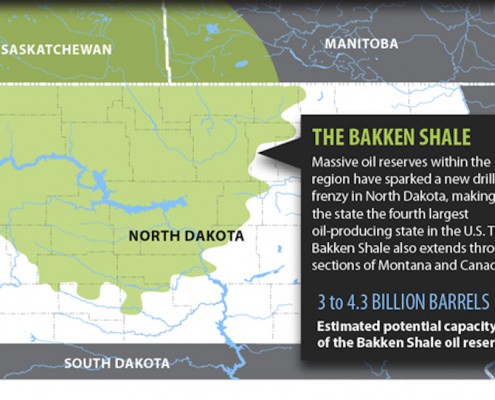 https://www.circleofblue.org/wp-content/uploads/2010/09/index_06-1.jpg
658
1000
Circle of Blue
https://www.circleofblue.org/wp-content/uploads/2018/06/Circle-of-Blue-Water-Speaks-600x139.png
Circle of Blue2010-09-22 04:13:172016-03-10 14:52:57Infographic: North Dakota’s Rise To Domestic Oil Royalty
https://www.circleofblue.org/wp-content/uploads/2010/09/index_06-1.jpg
658
1000
Circle of Blue
https://www.circleofblue.org/wp-content/uploads/2018/06/Circle-of-Blue-Water-Speaks-600x139.png
Circle of Blue2010-09-22 04:13:172016-03-10 14:52:57Infographic: North Dakota’s Rise To Domestic Oil Royalty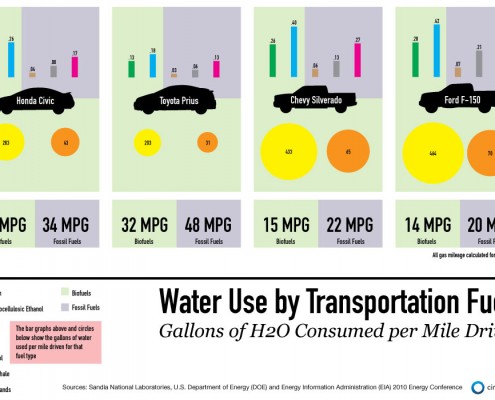 https://www.circleofblue.org/wp-content/uploads/2010/09/gwpm1000_0908-1.jpg
700
1000
Kalin Wood
https://www.circleofblue.org/wp-content/uploads/2018/06/Circle-of-Blue-Water-Speaks-600x139.png
Kalin Wood2010-09-08 16:10:052016-01-07 12:12:58Infographic: Water Use Per Mile Driven — Biofuels vs. Fossil Fuels
https://www.circleofblue.org/wp-content/uploads/2010/09/gwpm1000_0908-1.jpg
700
1000
Kalin Wood
https://www.circleofblue.org/wp-content/uploads/2018/06/Circle-of-Blue-Water-Speaks-600x139.png
Kalin Wood2010-09-08 16:10:052016-01-07 12:12:58Infographic: Water Use Per Mile Driven — Biofuels vs. Fossil Fuels https://www.circleofblue.org/wp-content/uploads/2010/07/graphmap.png
350
590
Circle of Blue
https://www.circleofblue.org/wp-content/uploads/2018/06/Circle-of-Blue-Water-Speaks-600x139.png
Circle of Blue2010-08-26 13:50:542012-05-21 12:15:12Infographic: Wastewater Treatment Costs in Major U.S. Cities
https://www.circleofblue.org/wp-content/uploads/2010/07/graphmap.png
350
590
Circle of Blue
https://www.circleofblue.org/wp-content/uploads/2018/06/Circle-of-Blue-Water-Speaks-600x139.png
Circle of Blue2010-08-26 13:50:542012-05-21 12:15:12Infographic: Wastewater Treatment Costs in Major U.S. Cities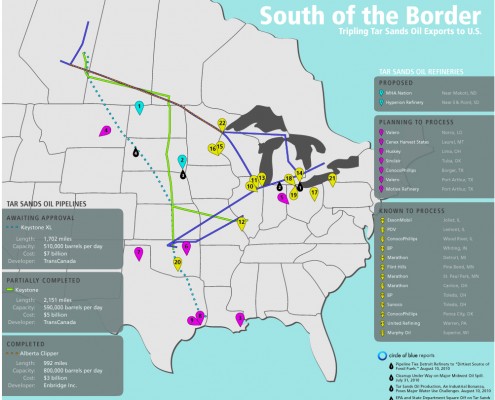 https://www.circleofblue.org/wp-content/uploads/2010/08/tarsands_map_rebecca_1000-1.jpg
851
1003
Circle of Blue
https://www.circleofblue.org/wp-content/uploads/2018/06/Circle-of-Blue-Water-Speaks-600x139.png
Circle of Blue2010-08-17 17:50:552016-01-05 14:00:00Infographic: Tripling Tar Sands Oil Imports, Pipeline and Refinery Map from Canada to U.S.
https://www.circleofblue.org/wp-content/uploads/2010/08/tarsands_map_rebecca_1000-1.jpg
851
1003
Circle of Blue
https://www.circleofblue.org/wp-content/uploads/2018/06/Circle-of-Blue-Water-Speaks-600x139.png
Circle of Blue2010-08-17 17:50:552016-01-05 14:00:00Infographic: Tripling Tar Sands Oil Imports, Pipeline and Refinery Map from Canada to U.S.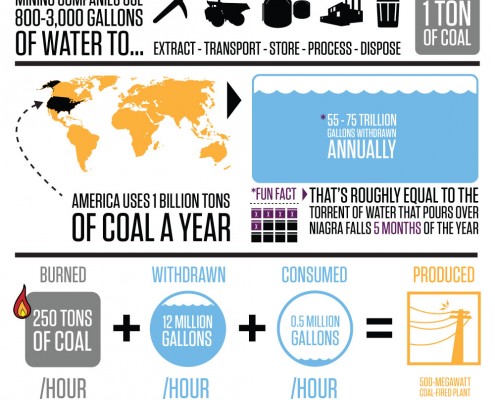 https://www.circleofblue.org/wp-content/uploads/2010/08/WOOD_COALFINAL10001-1.jpg
1060
1000
Kalin Wood
https://www.circleofblue.org/wp-content/uploads/2018/06/Circle-of-Blue-Water-Speaks-600x139.png
Kalin Wood2010-08-16 16:18:272016-02-18 14:40:35Infographic: Coal and Water – A Resource Mismatch
https://www.circleofblue.org/wp-content/uploads/2010/08/WOOD_COALFINAL10001-1.jpg
1060
1000
Kalin Wood
https://www.circleofblue.org/wp-content/uploads/2018/06/Circle-of-Blue-Water-Speaks-600x139.png
Kalin Wood2010-08-16 16:18:272016-02-18 14:40:35Infographic: Coal and Water – A Resource Mismatch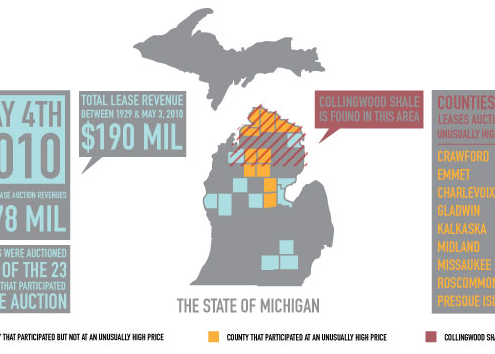 https://www.circleofblue.org/wp-content/uploads/2010/08/Screen-Shot-2016-01-05-at-2.47.12-PM.png
354
586
Kalin Wood
https://www.circleofblue.org/wp-content/uploads/2018/06/Circle-of-Blue-Water-Speaks-600x139.png
Kalin Wood2010-08-03 14:54:532016-02-18 14:29:02Infographic: Michigan Mineral Rights
https://www.circleofblue.org/wp-content/uploads/2010/08/Screen-Shot-2016-01-05-at-2.47.12-PM.png
354
586
Kalin Wood
https://www.circleofblue.org/wp-content/uploads/2018/06/Circle-of-Blue-Water-Speaks-600x139.png
Kalin Wood2010-08-03 14:54:532016-02-18 14:29:02Infographic: Michigan Mineral Rights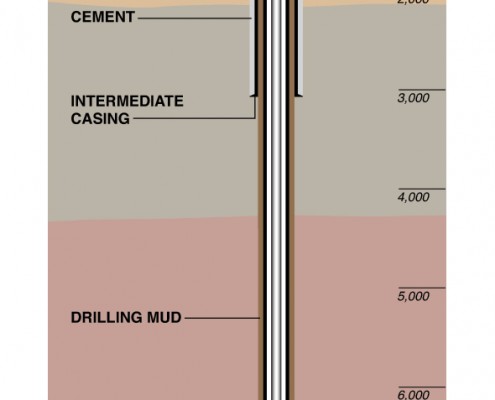 https://www.circleofblue.org/wp-content/uploads/2010/08/methane_graphic_590-1.jpg
1210
590
Circle of Blue
https://www.circleofblue.org/wp-content/uploads/2018/06/Circle-of-Blue-Water-Speaks-600x139.png
Circle of Blue2010-08-03 12:57:102016-01-05 14:51:20Infographic: Anatomy of a Gas Well
https://www.circleofblue.org/wp-content/uploads/2010/08/methane_graphic_590-1.jpg
1210
590
Circle of Blue
https://www.circleofblue.org/wp-content/uploads/2018/06/Circle-of-Blue-Water-Speaks-600x139.png
Circle of Blue2010-08-03 12:57:102016-01-05 14:51:20Infographic: Anatomy of a Gas Well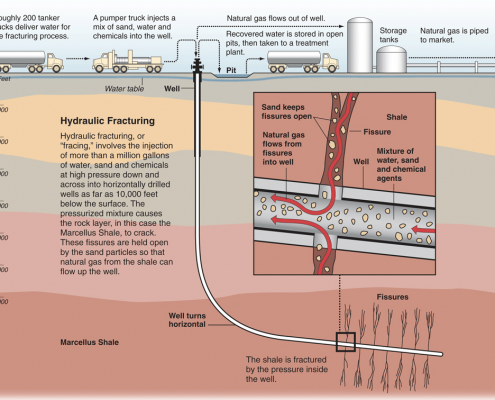 https://www.circleofblue.org/wp-content/uploads/2010/08/Screen-Shot-2016-01-05-at-2.50.34-PM.png
756
976
Circle of Blue
https://www.circleofblue.org/wp-content/uploads/2018/06/Circle-of-Blue-Water-Speaks-600x139.png
Circle of Blue2010-08-03 12:56:092016-01-05 14:51:29Infographic: What is Hydraulic Fracturing?
https://www.circleofblue.org/wp-content/uploads/2010/08/Screen-Shot-2016-01-05-at-2.50.34-PM.png
756
976
Circle of Blue
https://www.circleofblue.org/wp-content/uploads/2018/06/Circle-of-Blue-Water-Speaks-600x139.png
Circle of Blue2010-08-03 12:56:092016-01-05 14:51:29Infographic: What is Hydraulic Fracturing?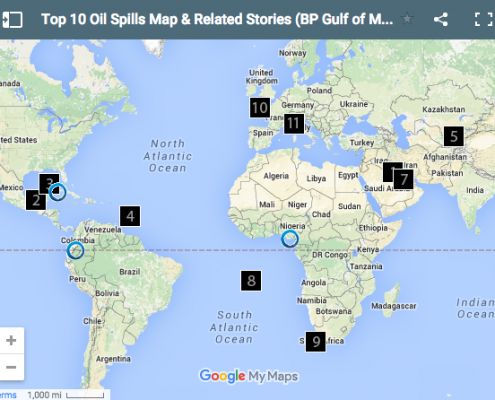 https://www.circleofblue.org/wp-content/uploads/2010/06/Screen-Shot-2016-01-04-at-12.55.34-PM.png
446
588
Circle of Blue
https://www.circleofblue.org/wp-content/uploads/2018/06/Circle-of-Blue-Water-Speaks-600x139.png
Circle of Blue2010-06-22 14:10:472016-01-04 13:09:26Interactive Map: Top Ten Global Oil Spills
https://www.circleofblue.org/wp-content/uploads/2010/06/Screen-Shot-2016-01-04-at-12.55.34-PM.png
446
588
Circle of Blue
https://www.circleofblue.org/wp-content/uploads/2018/06/Circle-of-Blue-Water-Speaks-600x139.png
Circle of Blue2010-06-22 14:10:472016-01-04 13:09:26Interactive Map: Top Ten Global Oil Spills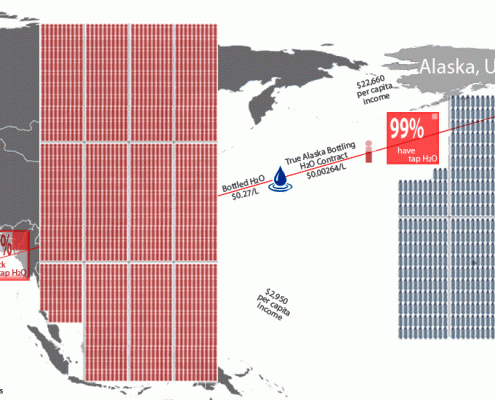 https://www.circleofblue.org/wp-content/uploads/2010/06/Sitka-India-1000-1.gif
550
1000
Aubrey Ann Parker
https://www.circleofblue.org/wp-content/uploads/2018/06/Circle-of-Blue-Water-Speaks-600x139.png
Aubrey Ann Parker2010-06-02 16:52:572016-01-20 10:24:26Infographic: Alaska to India Bulk Water Export Data
https://www.circleofblue.org/wp-content/uploads/2010/06/Sitka-India-1000-1.gif
550
1000
Aubrey Ann Parker
https://www.circleofblue.org/wp-content/uploads/2018/06/Circle-of-Blue-Water-Speaks-600x139.png
Aubrey Ann Parker2010-06-02 16:52:572016-01-20 10:24:26Infographic: Alaska to India Bulk Water Export Data

