
Posts
 https://www.circleofblue.org/wp-content/uploads/2011/07/pollution-590x250.jpg
250
590
Mark Townsend
https://www.circleofblue.org/wp-content/uploads/2018/06/Circle-of-Blue-Water-Speaks-600x139.png
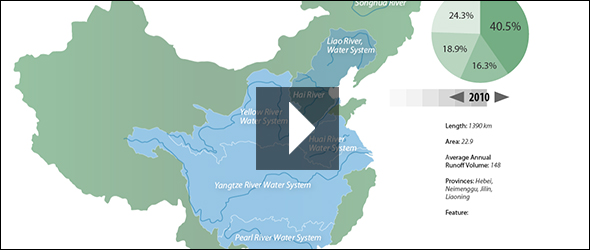
Mark Townsend2011-07-19 06:00:322016-02-18 15:00:18Infographic: Map of Pollution Levels in China’s Major River Basins
https://www.circleofblue.org/wp-content/uploads/2011/07/pollution-590x250.jpg
250
590
Mark Townsend
https://www.circleofblue.org/wp-content/uploads/2018/06/Circle-of-Blue-Water-Speaks-600x139.png
Mark Townsend2011-07-19 06:00:322016-02-18 15:00:18Infographic: Map of Pollution Levels in China’s Major River Basins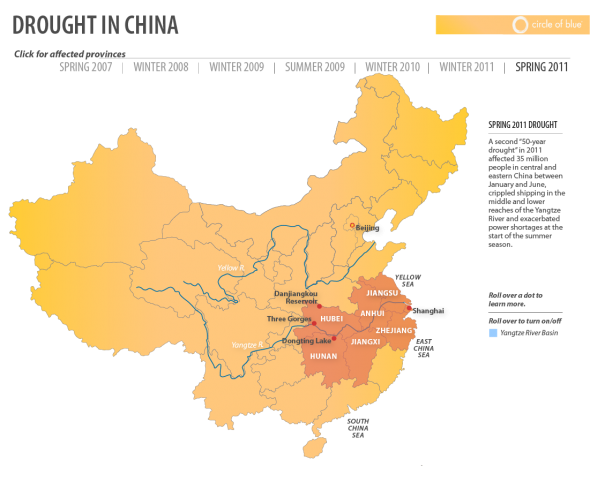 https://www.circleofblue.org/wp-content/uploads/2011/06/spring2011-01-590x4821.png
482
590
Mark Townsend
https://www.circleofblue.org/wp-content/uploads/2018/06/Circle-of-Blue-Water-Speaks-600x139.png
Mark Townsend2011-06-10 09:54:592015-12-11 12:13:59Infographic: Interactive Timeline Mapping China’s Drought-ridden Provinces Since 2007
https://www.circleofblue.org/wp-content/uploads/2011/06/spring2011-01-590x4821.png
482
590
Mark Townsend
https://www.circleofblue.org/wp-content/uploads/2018/06/Circle-of-Blue-Water-Speaks-600x139.png
Mark Townsend2011-06-10 09:54:592015-12-11 12:13:59Infographic: Interactive Timeline Mapping China’s Drought-ridden Provinces Since 2007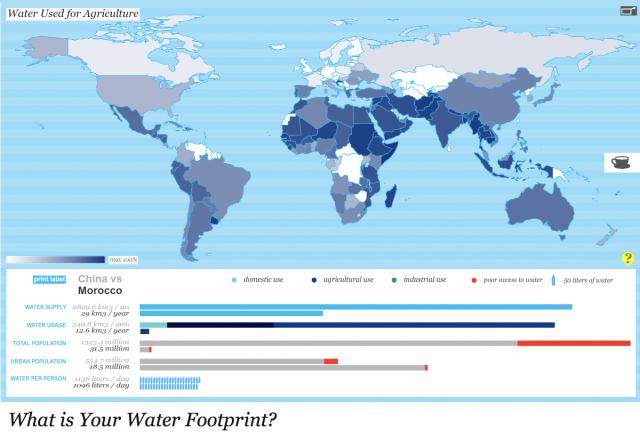 https://www.circleofblue.org/wp-content/uploads/2011/03/waterfootprint.jpg
438
640
Circle of Blue
https://www.circleofblue.org/wp-content/uploads/2018/06/Circle-of-Blue-Water-Speaks-600x139.png
Circle of Blue2011-03-25 16:04:152011-03-31 14:59:19Harvard Students Win Urban Water Design Challenge for Interactive Water Footprint Infographic
https://www.circleofblue.org/wp-content/uploads/2011/03/waterfootprint.jpg
438
640
Circle of Blue
https://www.circleofblue.org/wp-content/uploads/2018/06/Circle-of-Blue-Water-Speaks-600x139.png
Circle of Blue2011-03-25 16:04:152011-03-31 14:59:19Harvard Students Win Urban Water Design Challenge for Interactive Water Footprint Infographic https://www.circleofblue.org/wp-content/uploads/2011/03/chinas-five-year-plan-infographic.jpg
250
590
Circle of Blue
https://www.circleofblue.org/wp-content/uploads/2018/06/Circle-of-Blue-Water-Speaks-600x139.png
Circle of Blue2011-03-15 14:00:372016-04-27 22:47:23Infographic: Successes and Failures of China’s Five-Year Plans (1996 -2010)
https://www.circleofblue.org/wp-content/uploads/2011/03/chinas-five-year-plan-infographic.jpg
250
590
Circle of Blue
https://www.circleofblue.org/wp-content/uploads/2018/06/Circle-of-Blue-Water-Speaks-600x139.png
Circle of Blue2011-03-15 14:00:372016-04-27 22:47:23Infographic: Successes and Failures of China’s Five-Year Plans (1996 -2010) https://www.circleofblue.org/wp-content/uploads/2010/06/Sitka-India-1000-1.gif
550
1000
Aubrey Ann Parker
https://www.circleofblue.org/wp-content/uploads/2018/06/Circle-of-Blue-Water-Speaks-600x139.png
Aubrey Ann Parker2010-06-02 16:52:572016-01-20 10:24:26Infographic: Alaska to India Bulk Water Export Data
https://www.circleofblue.org/wp-content/uploads/2010/06/Sitka-India-1000-1.gif
550
1000
Aubrey Ann Parker
https://www.circleofblue.org/wp-content/uploads/2018/06/Circle-of-Blue-Water-Speaks-600x139.png
Aubrey Ann Parker2010-06-02 16:52:572016-01-20 10:24:26Infographic: Alaska to India Bulk Water Export Data

