Posts
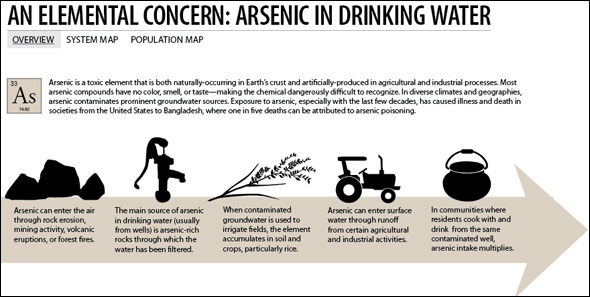
Infographic: An Elemental Concern—Arsenic in Drinking Water
2 Comments
/
Arsenic is both naturally occurring and artificially produced, and the toxin is very dangerous since it often has no color, taste, or smell. This graphic breaks down how arsenic gets into drinking water supplies and how arsenic affects the U.S. on the state level.
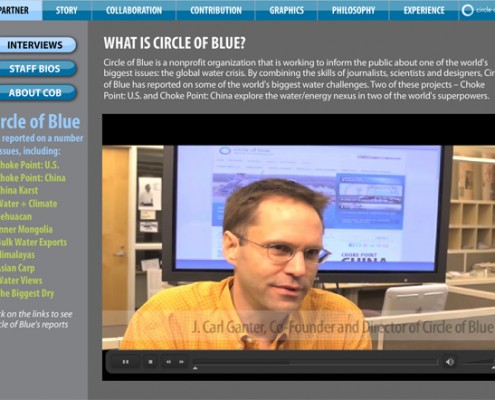
Behind The Scenes: Ball State University’s Collaboration with Circle of Blue
For her senior thesis project, Season Schafer, a student in Ball…
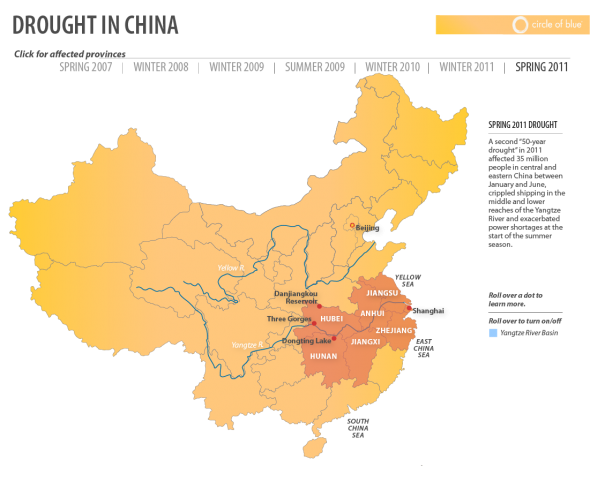
Infographic: Interactive Timeline Mapping China’s Drought-ridden Provinces Since 2007
Water scarcity is becoming an increasingly persistent problem…
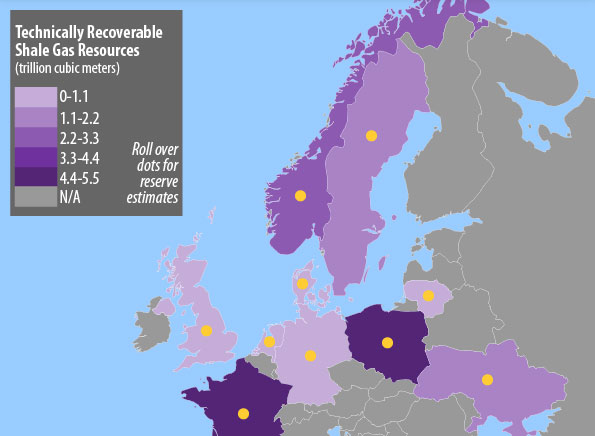
Infographic: Fracking Imports and Exports in Europe — Natural Gas Reserves, Production, and Consumption by Country
How do shale gas reserves measure up in European countries?

Infographic: How Desalination Works
What is the process, and how much energy does it take? This video describes two common methods—reverse osmosis and flash distillation—for obtaining water from the sea.
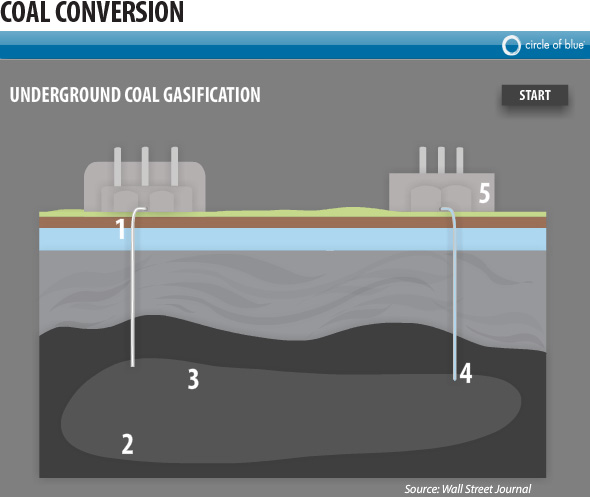
Infographic: Underground Coal Conversion — Creating Fuels and Fertilizers with Less Water
Though the chemistry and industrial processes for coal gasification…
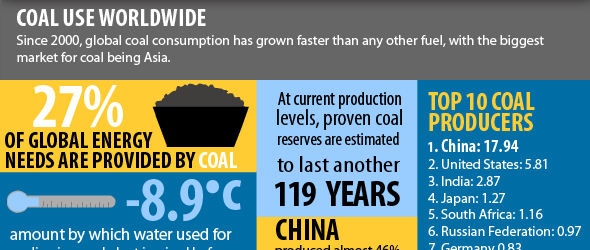
Infographic: China Leads Top 10 Coal Producing and Consuming Nations
Since 2000, global coal consumption has grown faster than any other fuel, with the biggest market for coal in Asia. Although China tops the global list for both coal consumption and production, the nation has emerged as the world's leading builder of clean coal technology.
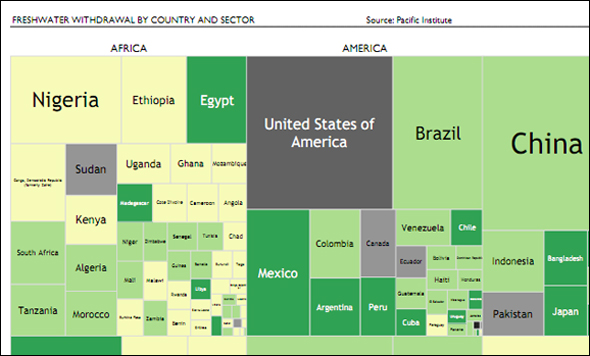
Infographic: Tree Map of Freshwater Withdrawal by Country — A Comparison Between Continents
Does the population of a country affects to its freshwater withdrawal? and its geographic location? Are there differences between Continents? and within them? How the availability of freshwater is spread around the economic sectors?
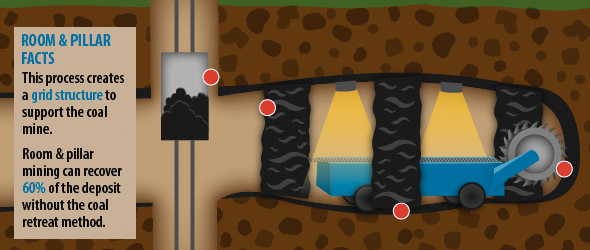
Infographic: Three Types of Coal Mining — Process and Facts
Opencast mining involves scraping at the ground's surface, while room and pillar mining occurs below ground. Likewise, longwall mining uses heavy machinery to dig at coal seams beneath the surface: learn more in this interactive inforgraphic.
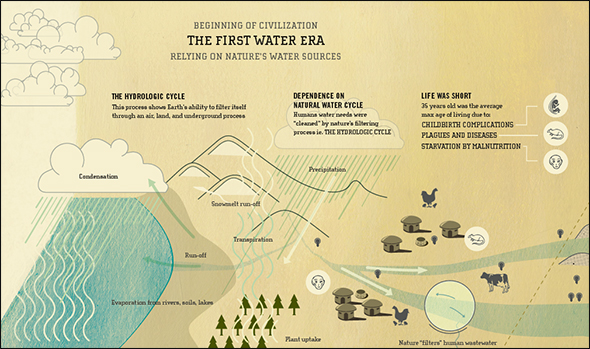
Infographic: Three Eras of Water — The History of the Relationship Between Civilization and Nature
The infographic portrays the evolution of water technology, including its immediate successes of human progress and the disadvantages of that progress. Based on an essay by Peter Gleick, the scientific, social, and historical findings are translated into this piece, putting those patterns in a contemporary light.
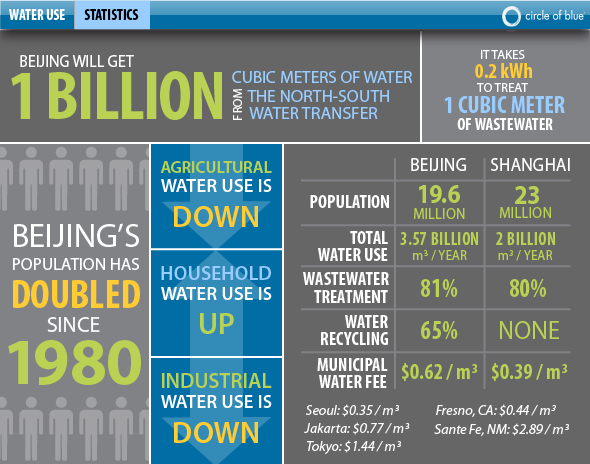
Infographic: Beijing Water Use and Population Statistics
The population of China's capital has doubled since 1980, and, though agricultural and industrial water use is down, municipal use is up.
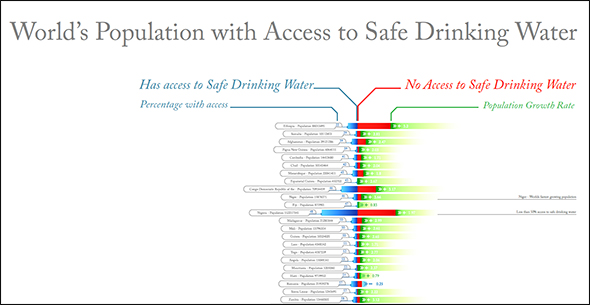
Infographic: World’s Population with Access to Safe Drinking Water
Entry in the 2011 Urban Water Design Challenge, sponsored by…


