Posts
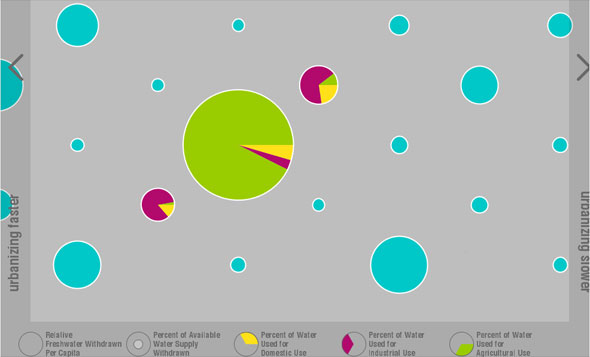
Infographic: Breakdown of Water Consumption and Use in Fastest-Urbanizing Countries
0 Comments
/
The relative water consumption per capita, percent usage of available freshwater in each country, and the respective breakdowns of use in agricultural, municipal, and industrial sectors are shown for the 120 fastest-urbanizing countries.
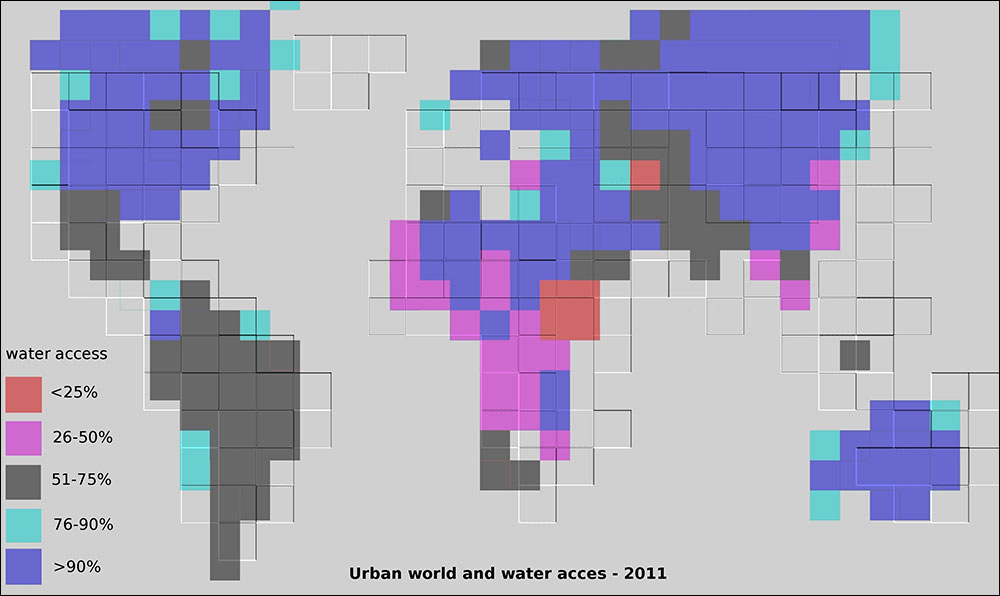
Infographic: Urban Areas vs. Water Access Global Map
This is a global overview of the water access (as a percentage of population) and of the urban factor.
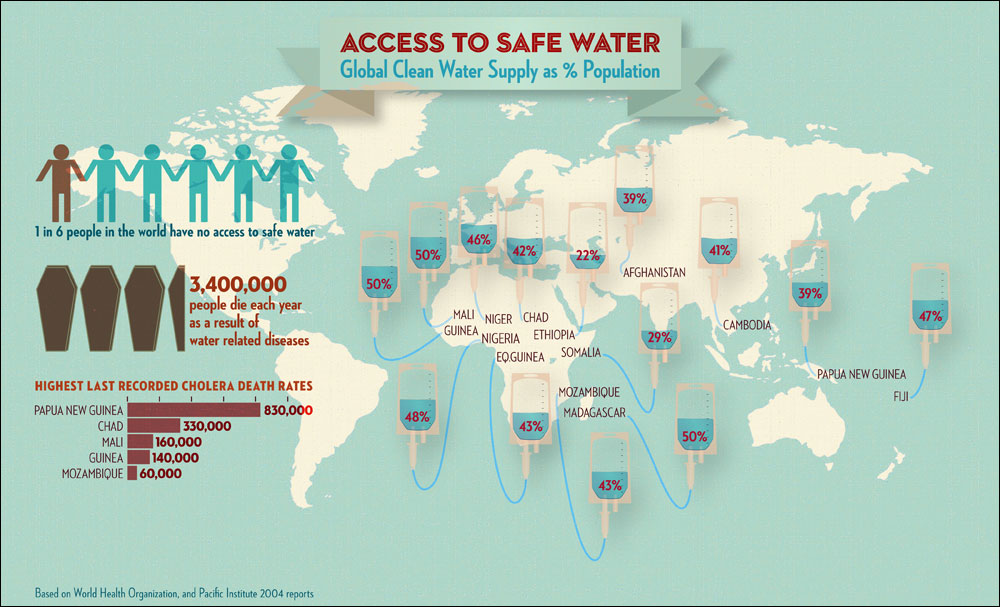
Infographic: Access to Safe Water—Countries Where Less Than 50 Percent Have Access
Global clean water supply by countries those less than 50% of the population can reach, and its facts, based on WHO and Pacific Institute 2004 reports.
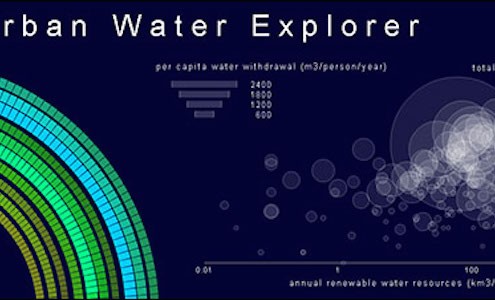
Infographic: Interactive Urban Water Explorer
Entry in the 2011 Urban Water Design Challenge, sponsored by Visualizing.org and Circle of Blue.
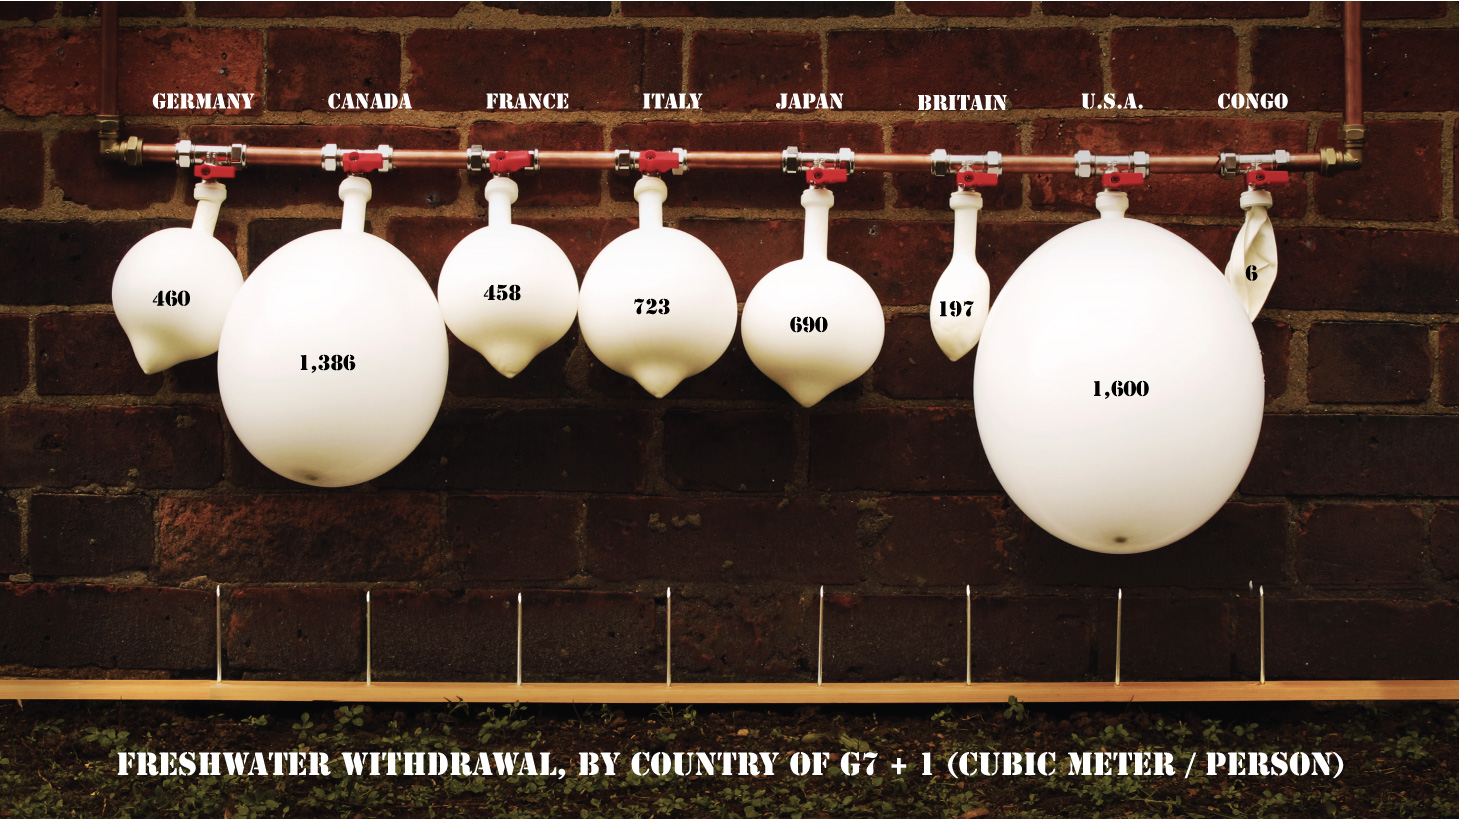
Infographic: Freshwater Withdrawal by G7 Country
This visualization visually and physically describes the freshwater withdrawal per capita from the G7 and another nation.

Q&A: Ma Jun on China’s Economic Development and Water Resources
Ma Jun tells Circle of Blue that China is still on the track of a highly energy- and resource-intensive model, with the need to de-couple economic growth from the expansion of resource consumption
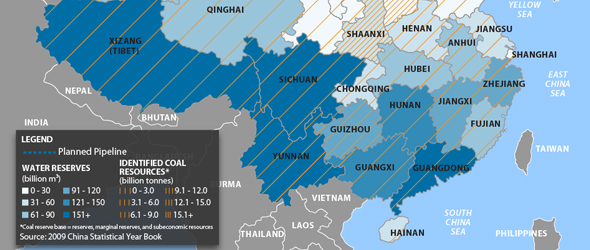
Infographic: Bohai Pipeline Map — Coal Reserves vs. Water Resources in Northern China
A look at China's coal-rich, yet water-scarce northern region.
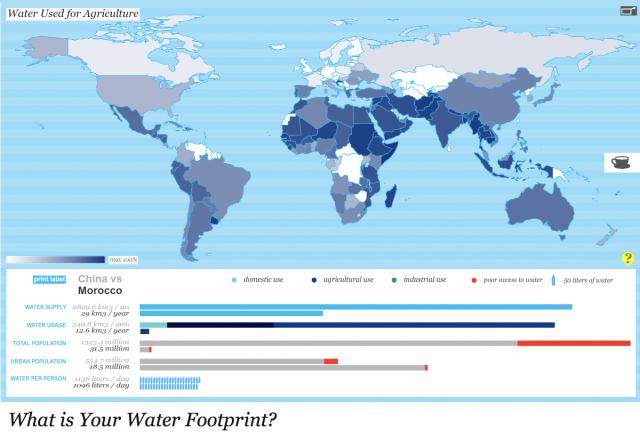
Infographic: What Is Your Water Footprint?
Winner of the 2011 Urban Water Design Challenge, sponsored by Visualizing.org and Circle of Blue.
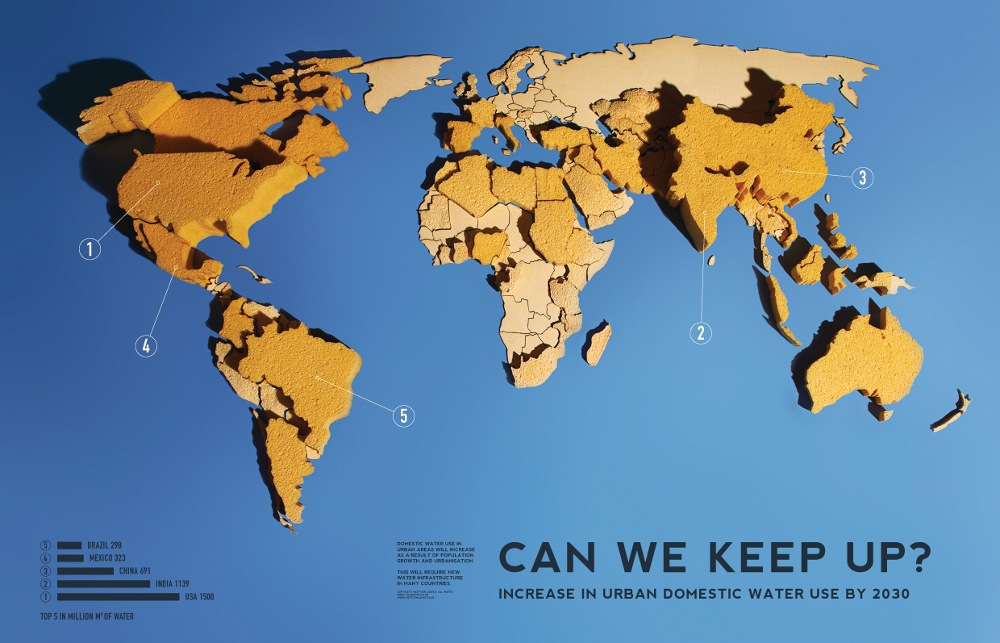
Infographic: Can We Keep Up? Increase in Urban Domestic Water Use by 2030
Runner-up in the 2011 Urban Water Design Challenge, sponsored by Visualizing.org and Circle of Blue.
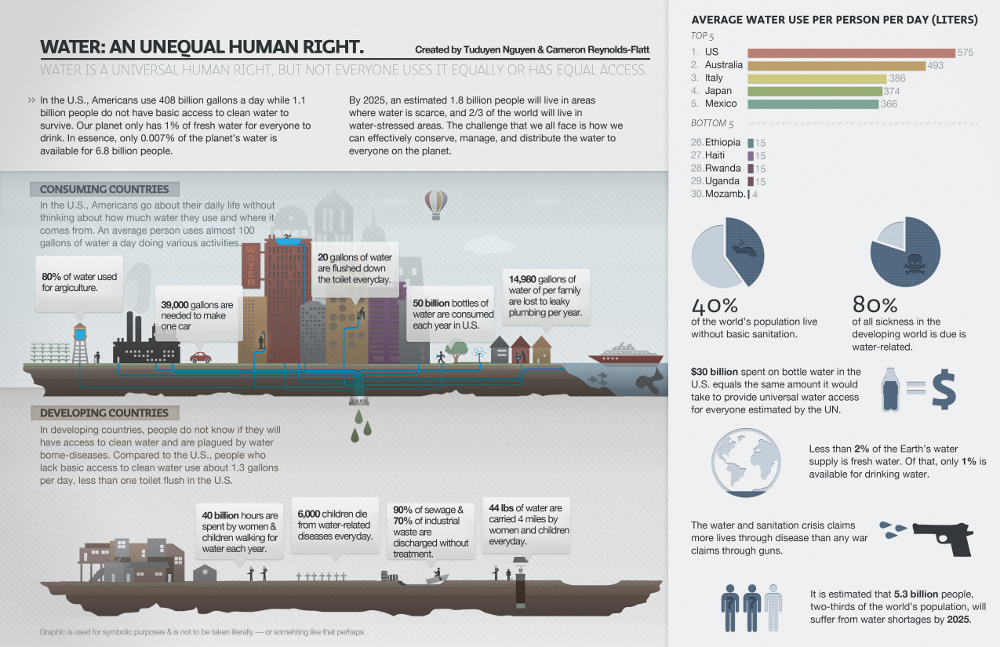
Infographic: Water – An Unequal Human Right
Runner-up in the 2011 Urban Water Design Challenge, sponsored by Visualizing.org and Circle of Blue.

Harvard Students Win Urban Water Design Challenge for Interactive Water Footprint Infographic
Three weeks, 36 entries: Global competition sponsored by Circle of Blue and Visualizing.org.

Infographic: Successes and Failures of China’s Five-Year Plans (1996 -2010)
A breakdown of previous plans gives context to the newly released 12th Five-Year Plan.


