Posts
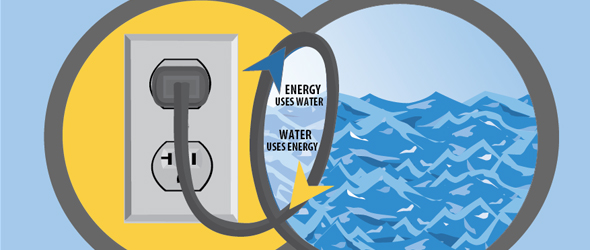
Infographic: Water and Energy
2 Comments
/
The emerging collision between the diminishing water supplies and the rising energy demand across the sectors of the U.S. economy.
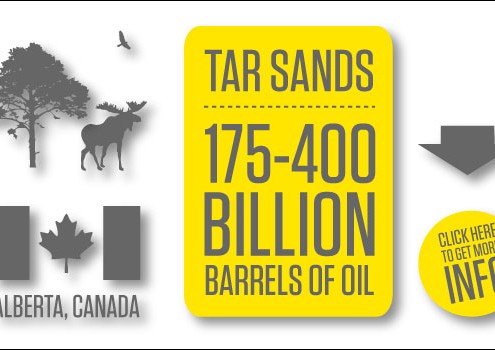
Infographic: A Closer Look at Tar Sands Oil
185 gallons of water + two tons of soil + 700-1200 cubic feet of natural gas
= one barrel of crude oil.
 https://www.circleofblue.org/wp-content/uploads/2010/09/Screen-Shot-2016-01-07-at-11.46.28-AM.png
418
575
Circle of Blue
https://www.circleofblue.org/wp-content/uploads/2018/06/Circle-of-Blue-Water-Speaks-600x139.png
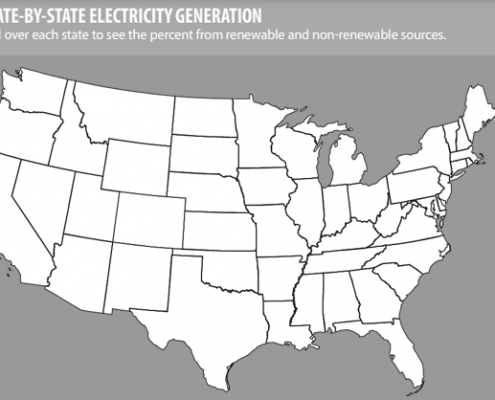
Circle of Blue2010-09-22 04:42:142016-01-05 07:08:29Infographic: U.S. Power Sources
Infographic: State Legislatures Bridge Water-Energy Gap
A look at 16 states with statutes that acknowledge the tightening chokepoint between declining water resources and rising energy demand.

Infographic: 10 Things You Should Know about Water + Energy
A survey of key water facts behind traditional and alternative energy sources.
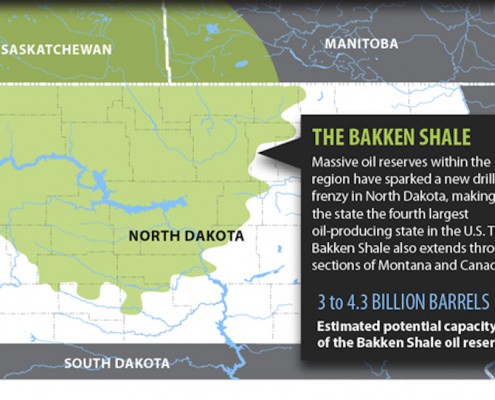
Infographic: North Dakota’s Rise To Domestic Oil Royalty
North Dakota has become the number four oil producing state—but at what cost to its water supply?
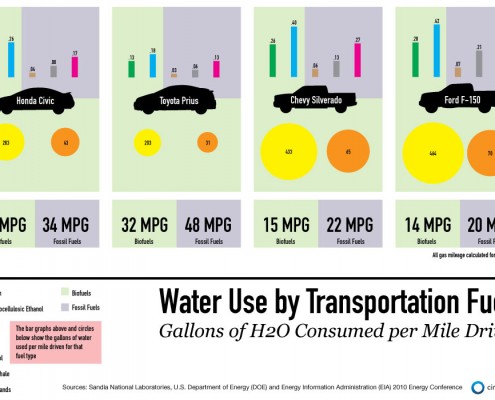
Infographic: Water Use Per Mile Driven — Biofuels vs. Fossil Fuels
A breakdown of gallons of water used by transportation fuels per mile.
Q&A: James G. Workman on the Bushmen’s Fight for Water Rights and 21st Century Hydro-Democracy
Workman says chances of the Botswanian government returning water rights to the Bushmen as 'pretty slim.'

Photo Slideshow: Tar Sands Oil Refinery Burdens a Detroit Community
Residents face the environmental and health consequences of a Marathon refinery expansion.
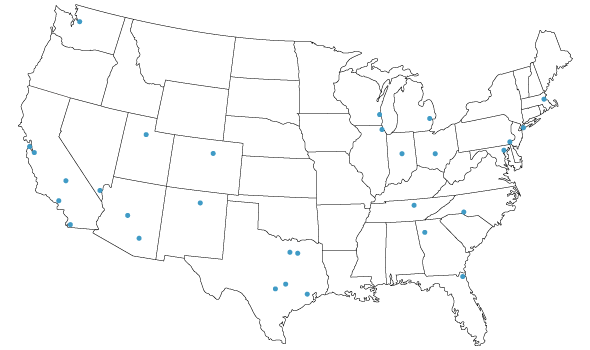
Infographic: Wastewater Treatment Costs in Major U.S. Cities
Following Circle of Blue’s survey of water prices, we examine the wastewater costs of the same 30 major cities.
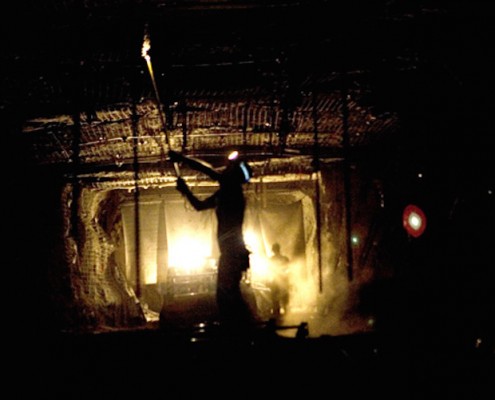
Photo Slideshow: A Desperate Clinch — Coal Production Across America
A look at the places and faces affected by coal production in the United States.

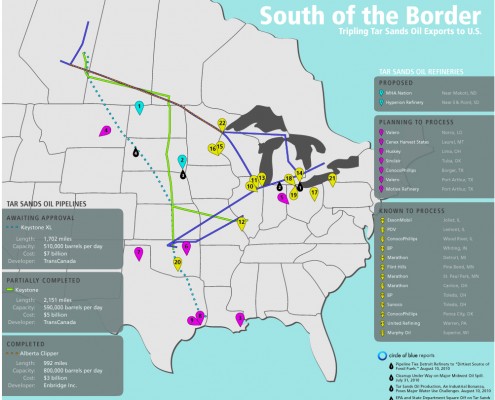
Infographic: Tripling Tar Sands Oil Imports, Pipeline and Refinery Map from Canada to U.S.
The industry is spending billions of dollars to develop more U.S. pipelines.


