
Posts
 https://www.circleofblue.org/wp-content/uploads/2015/06/20150501_JCGanter_Calif_CentralValley_G3_5882-590px.jpg
394
590
J. Carl Ganter
https://www.circleofblue.org/wp-content/uploads/2018/06/Circle-of-Blue-Water-Speaks-600x139.png
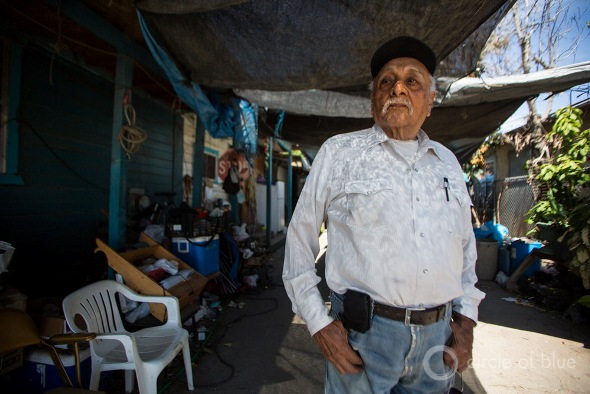
J. Carl Ganter2015-06-26 15:02:322016-03-14 11:22:57Slideshow: Faces of Tulare County’s Drinking Water Crisis
https://www.circleofblue.org/wp-content/uploads/2015/06/20150501_JCGanter_Calif_CentralValley_G3_5882-590px.jpg
394
590
J. Carl Ganter
https://www.circleofblue.org/wp-content/uploads/2018/06/Circle-of-Blue-Water-Speaks-600x139.png
J. Carl Ganter2015-06-26 15:02:322016-03-14 11:22:57Slideshow: Faces of Tulare County’s Drinking Water Crisis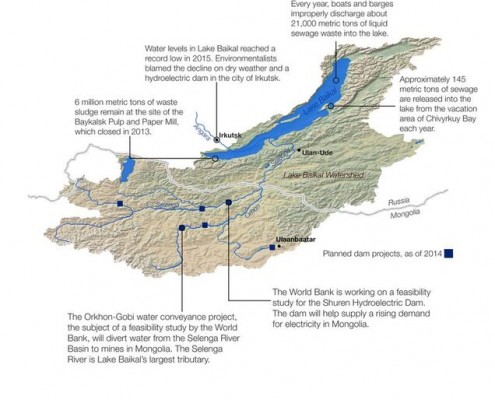 https://www.circleofblue.org/wp-content/uploads/2015/06/lakebaikal.jpeg
1024
636
Kaye LaFond
https://www.circleofblue.org/wp-content/uploads/2018/06/Circle-of-Blue-Water-Speaks-600x139.png
Kaye LaFond2015-06-19 16:31:112016-04-10 18:28:45Infographic: Lake Baikal Pollution Leads to Algae Blooms
https://www.circleofblue.org/wp-content/uploads/2015/06/lakebaikal.jpeg
1024
636
Kaye LaFond
https://www.circleofblue.org/wp-content/uploads/2018/06/Circle-of-Blue-Water-Speaks-600x139.png
Kaye LaFond2015-06-19 16:31:112016-04-10 18:28:45Infographic: Lake Baikal Pollution Leads to Algae Blooms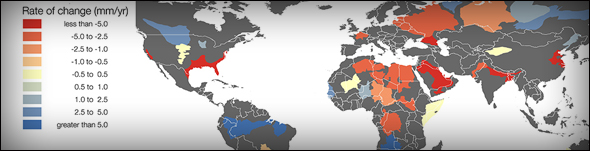 https://www.circleofblue.org/wp-content/uploads/2015/06/newsletter_banner-state-of-grace.jpg
151
590
Kaye LaFond
https://www.circleofblue.org/wp-content/uploads/2018/06/Circle-of-Blue-Water-Speaks-600x139.png
Kaye LaFond2015-06-19 15:56:012016-03-31 11:47:30Infographic: NASA Satellites Reveal Global Groundwater Depletion
https://www.circleofblue.org/wp-content/uploads/2015/06/newsletter_banner-state-of-grace.jpg
151
590
Kaye LaFond
https://www.circleofblue.org/wp-content/uploads/2018/06/Circle-of-Blue-Water-Speaks-600x139.png
Kaye LaFond2015-06-19 15:56:012016-03-31 11:47:30Infographic: NASA Satellites Reveal Global Groundwater Depletion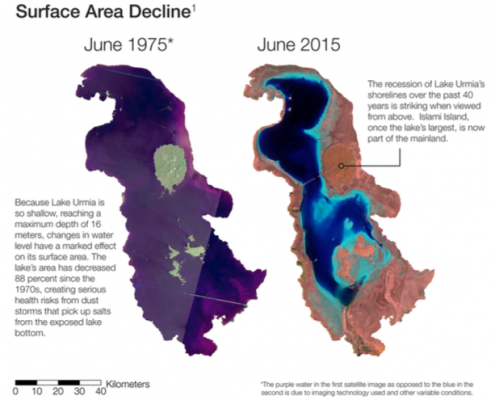 https://www.circleofblue.org/wp-content/uploads/2015/06/Screen-Shot-2015-12-31-at-12.00.29-PM.png
498
613
Kaye LaFond
https://www.circleofblue.org/wp-content/uploads/2018/06/Circle-of-Blue-Water-Speaks-600x139.png
Kaye LaFond2015-06-12 07:00:342016-03-31 11:40:23Infographic: Lake Urmia Drained By Water Diversions
https://www.circleofblue.org/wp-content/uploads/2015/06/Screen-Shot-2015-12-31-at-12.00.29-PM.png
498
613
Kaye LaFond
https://www.circleofblue.org/wp-content/uploads/2018/06/Circle-of-Blue-Water-Speaks-600x139.png
Kaye LaFond2015-06-12 07:00:342016-03-31 11:40:23Infographic: Lake Urmia Drained By Water Diversions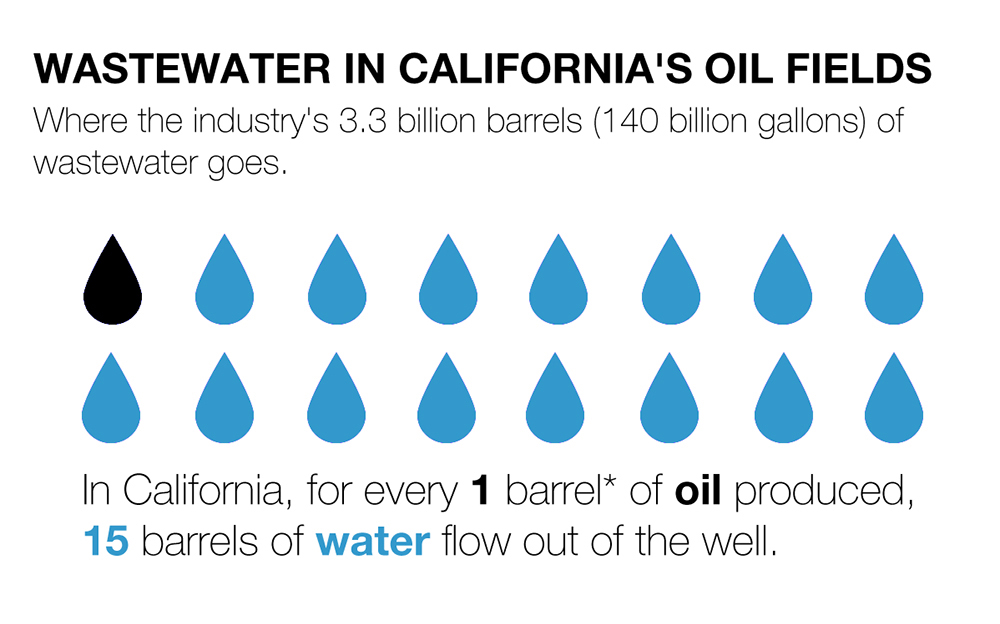 https://www.circleofblue.org/wp-content/uploads/2015/05/calwastewaterrecycling11.jpg
624
1000
Kaye LaFond
https://www.circleofblue.org/wp-content/uploads/2018/06/Circle-of-Blue-Water-Speaks-600x139.png
Kaye LaFond2015-05-29 06:00:512019-05-23 11:09:37Infographic: Wastewater in California’s Oil Fields
https://www.circleofblue.org/wp-content/uploads/2015/05/calwastewaterrecycling11.jpg
624
1000
Kaye LaFond
https://www.circleofblue.org/wp-content/uploads/2018/06/Circle-of-Blue-Water-Speaks-600x139.png
Kaye LaFond2015-05-29 06:00:512019-05-23 11:09:37Infographic: Wastewater in California’s Oil Fields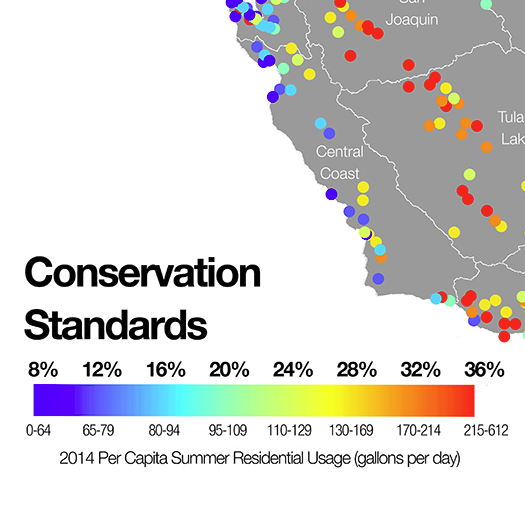 https://www.circleofblue.org/wp-content/uploads/2015/05/info-thumb.jpg
525
525
Kaye LaFond
https://www.circleofblue.org/wp-content/uploads/2018/06/Circle-of-Blue-Water-Speaks-600x139.png
Kaye LaFond2015-05-19 12:13:522016-04-12 15:37:34Infographic: California Urban Water Conservation Standards
https://www.circleofblue.org/wp-content/uploads/2015/05/info-thumb.jpg
525
525
Kaye LaFond
https://www.circleofblue.org/wp-content/uploads/2018/06/Circle-of-Blue-Water-Speaks-600x139.png
Kaye LaFond2015-05-19 12:13:522016-04-12 15:37:34Infographic: California Urban Water Conservation Standards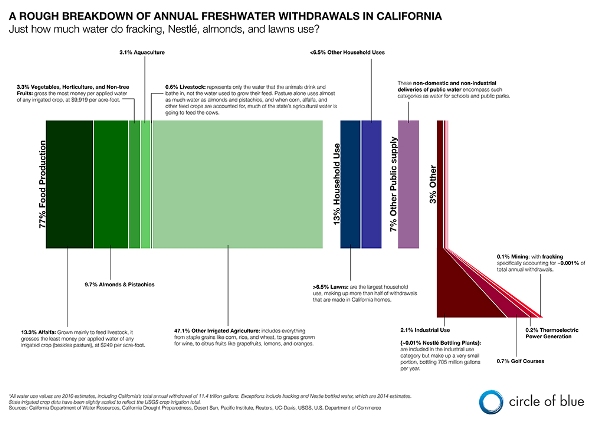 https://www.circleofblue.org/wp-content/uploads/2015/05/CaliforniaWaterUse590.jpg
423
590
Kaye LaFond
https://www.circleofblue.org/wp-content/uploads/2018/06/Circle-of-Blue-Water-Speaks-600x139.png
Kaye LaFond2015-05-14 13:04:332016-04-12 15:32:02Infographic: California Freshwater Withdrawals
https://www.circleofblue.org/wp-content/uploads/2015/05/CaliforniaWaterUse590.jpg
423
590
Kaye LaFond
https://www.circleofblue.org/wp-content/uploads/2018/06/Circle-of-Blue-Water-Speaks-600x139.png
Kaye LaFond2015-05-14 13:04:332016-04-12 15:32:02Infographic: California Freshwater Withdrawals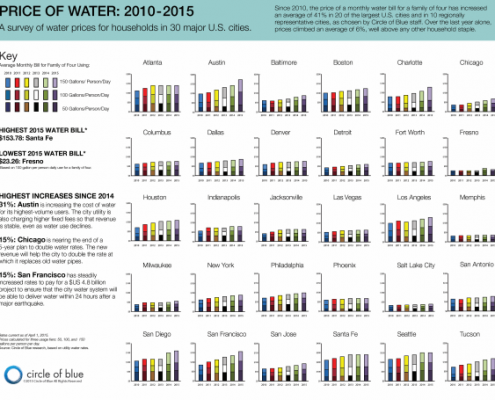 https://www.circleofblue.org/wp-content/uploads/2015/04/Screen-Shot-2016-01-04-at-1.23.58-PM.png
455
580
Kaye LaFond
https://www.circleofblue.org/wp-content/uploads/2018/06/Circle-of-Blue-Water-Speaks-600x139.png
Kaye LaFond2015-04-24 15:09:182016-10-17 14:15:14Infographic: Price of Water in 30 Major U.S. Cities (2010-2015)
https://www.circleofblue.org/wp-content/uploads/2015/04/Screen-Shot-2016-01-04-at-1.23.58-PM.png
455
580
Kaye LaFond
https://www.circleofblue.org/wp-content/uploads/2018/06/Circle-of-Blue-Water-Speaks-600x139.png
Kaye LaFond2015-04-24 15:09:182016-10-17 14:15:14Infographic: Price of Water in 30 Major U.S. Cities (2010-2015)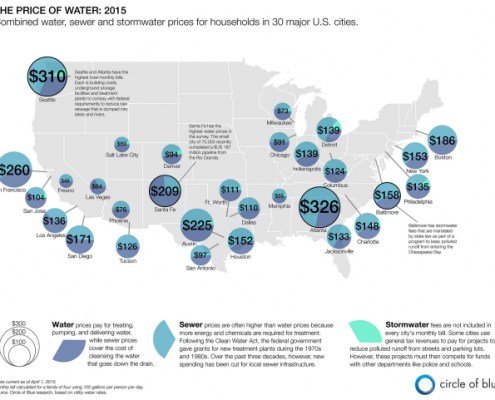 https://www.circleofblue.org/wp-content/uploads/2015/04/Screen-Shot-2016-01-04-at-1.27.32-PM.png
481
633
Kaye LaFond
https://www.circleofblue.org/wp-content/uploads/2018/06/Circle-of-Blue-Water-Speaks-600x139.png
Kaye LaFond2015-04-24 14:10:332016-10-14 10:01:50Infographic: 2015 Price of U.S. Water, Sewer, and Stormwater
https://www.circleofblue.org/wp-content/uploads/2015/04/Screen-Shot-2016-01-04-at-1.27.32-PM.png
481
633
Kaye LaFond
https://www.circleofblue.org/wp-content/uploads/2018/06/Circle-of-Blue-Water-Speaks-600x139.png
Kaye LaFond2015-04-24 14:10:332016-10-14 10:01:50Infographic: 2015 Price of U.S. Water, Sewer, and Stormwater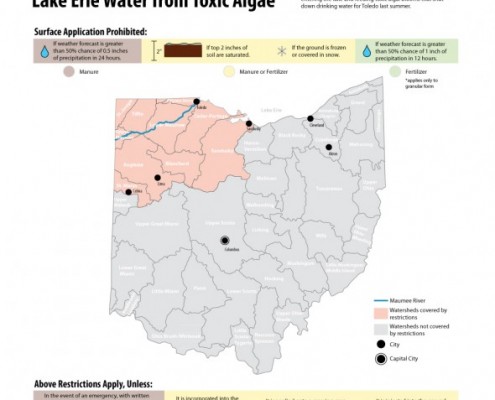 https://www.circleofblue.org/wp-content/uploads/2015/04/OhioFertilizerLawFinal-590x590-1.jpg
590
590
Codi Kozacek
https://www.circleofblue.org/wp-content/uploads/2018/06/Circle-of-Blue-Water-Speaks-600x139.png
Codi Kozacek2015-04-23 16:19:562016-03-14 11:40:05Infographic: Ohio Passes Farm Regulations to Stop Lake Erie Toxic Algae
https://www.circleofblue.org/wp-content/uploads/2015/04/OhioFertilizerLawFinal-590x590-1.jpg
590
590
Codi Kozacek
https://www.circleofblue.org/wp-content/uploads/2018/06/Circle-of-Blue-Water-Speaks-600x139.png
Codi Kozacek2015-04-23 16:19:562016-03-14 11:40:05Infographic: Ohio Passes Farm Regulations to Stop Lake Erie Toxic Algae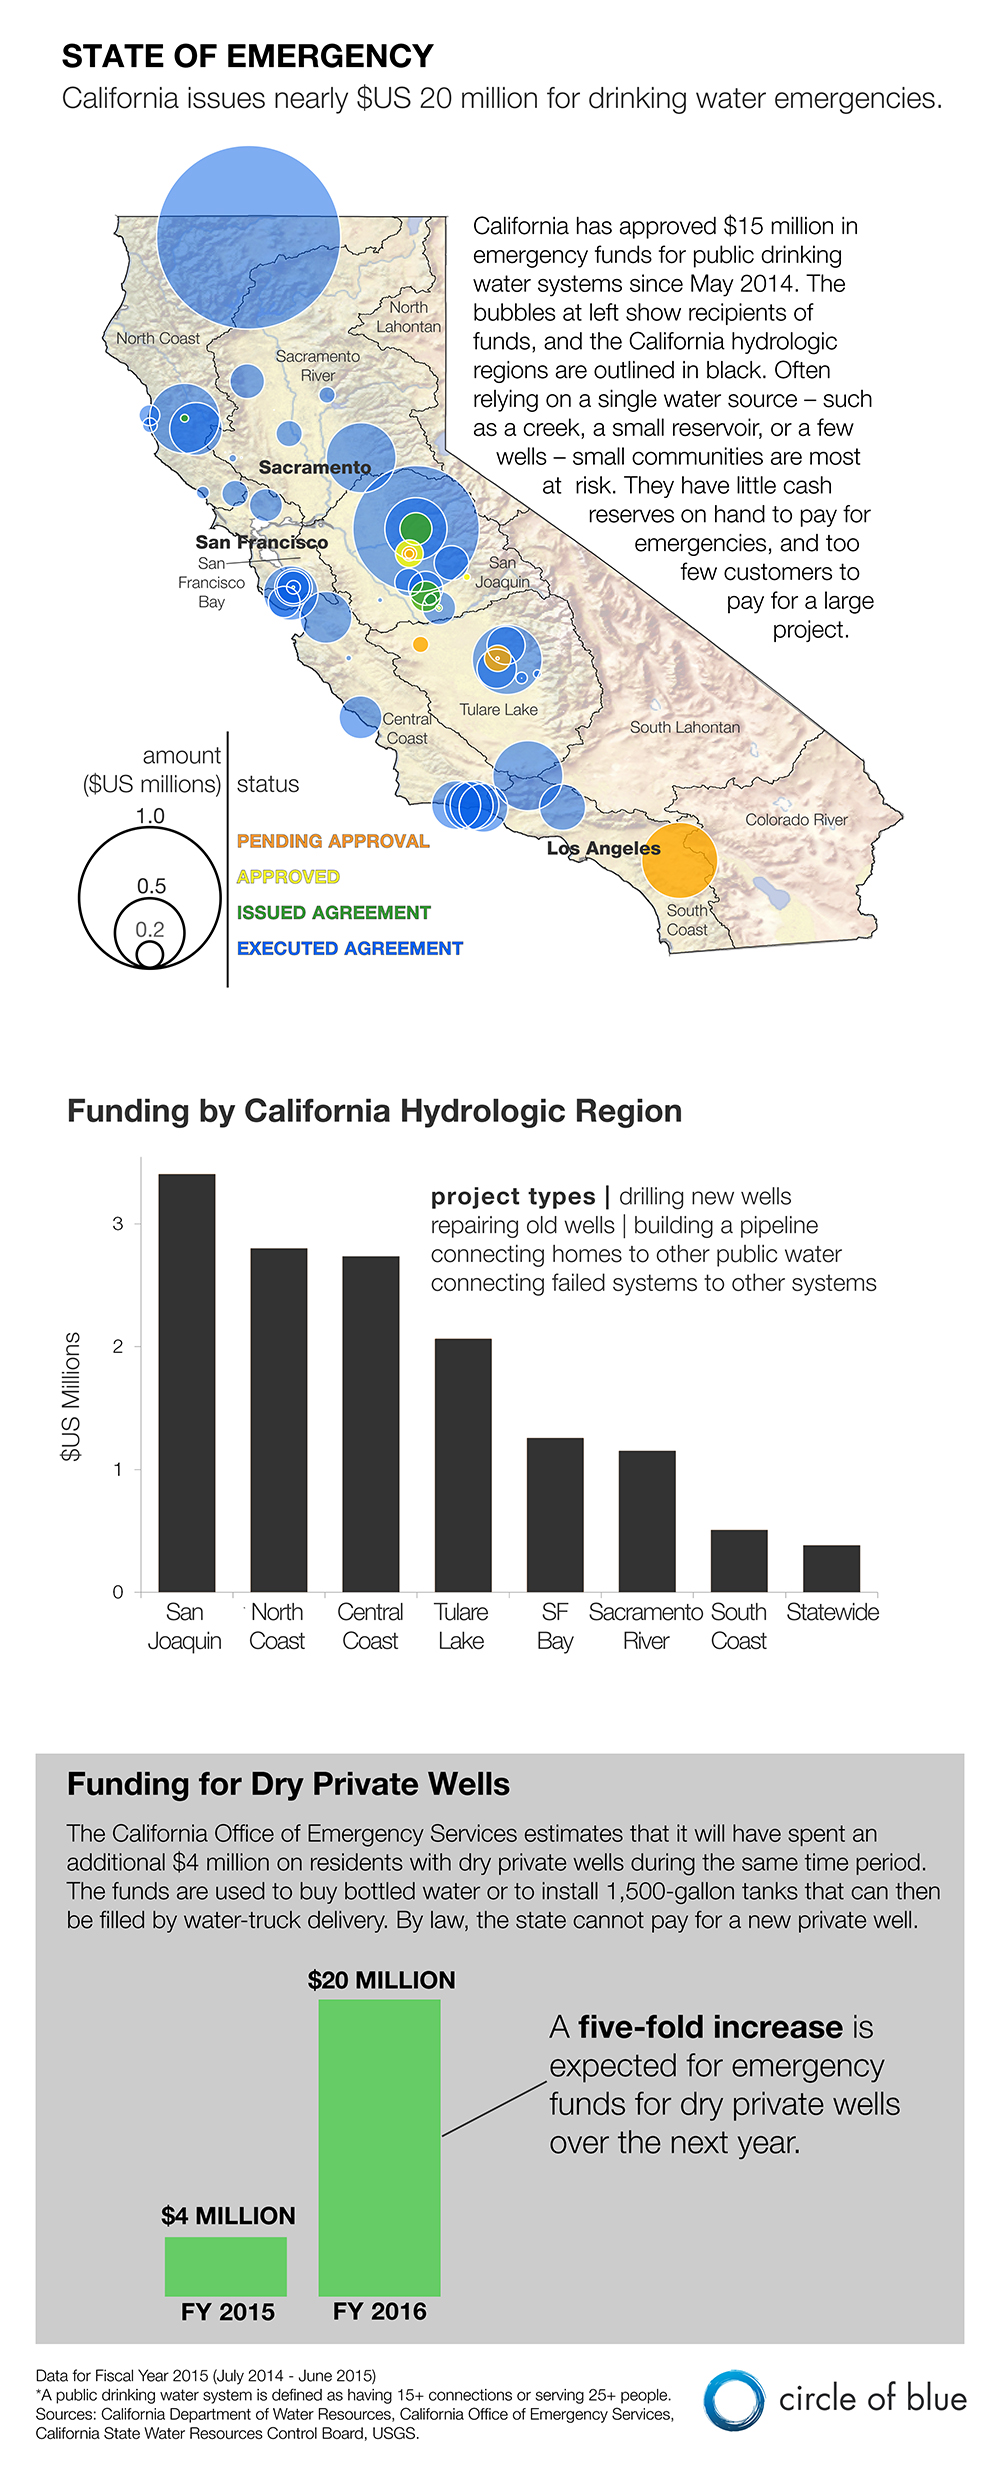 https://www.circleofblue.org/wp-content/uploads/2015/04/emergencywater-3.jpg
2476
1000
Kaye LaFond
https://www.circleofblue.org/wp-content/uploads/2018/06/Circle-of-Blue-Water-Speaks-600x139.png
Kaye LaFond2015-04-17 06:00:002016-04-12 15:36:22Infographic: Emergency Water Funds for California Communities (May 2014-July 2015)
https://www.circleofblue.org/wp-content/uploads/2015/04/emergencywater-3.jpg
2476
1000
Kaye LaFond
https://www.circleofblue.org/wp-content/uploads/2018/06/Circle-of-Blue-Water-Speaks-600x139.png
Kaye LaFond2015-04-17 06:00:002016-04-12 15:36:22Infographic: Emergency Water Funds for California Communities (May 2014-July 2015)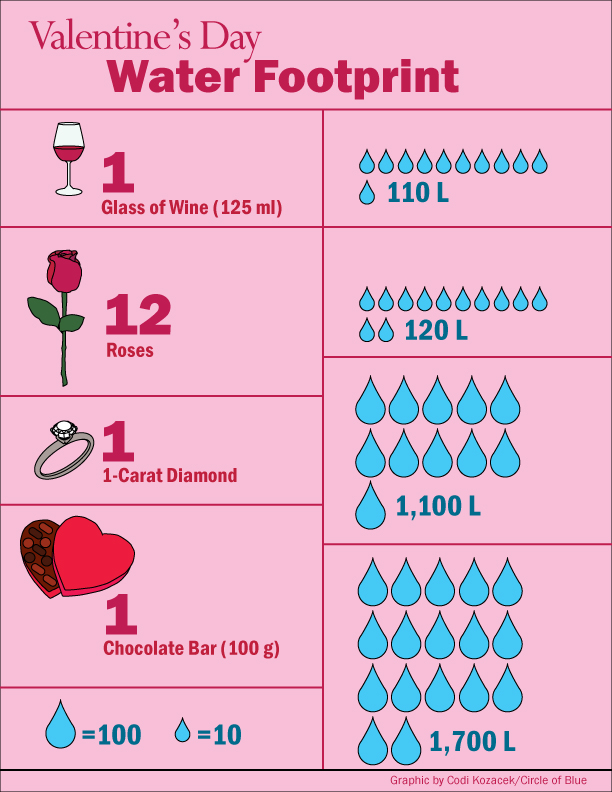 https://www.circleofblue.org/wp-content/uploads/2015/02/VDay.jpg
792
612
Codi Kozacek
https://www.circleofblue.org/wp-content/uploads/2018/06/Circle-of-Blue-Water-Speaks-600x139.png
Codi Kozacek2015-02-14 13:37:552016-03-14 11:46:54Infographic: Water Footprint of Valentine’s Day
https://www.circleofblue.org/wp-content/uploads/2015/02/VDay.jpg
792
612
Codi Kozacek
https://www.circleofblue.org/wp-content/uploads/2018/06/Circle-of-Blue-Water-Speaks-600x139.png
Codi Kozacek2015-02-14 13:37:552016-03-14 11:46:54Infographic: Water Footprint of Valentine’s Day

