Posts
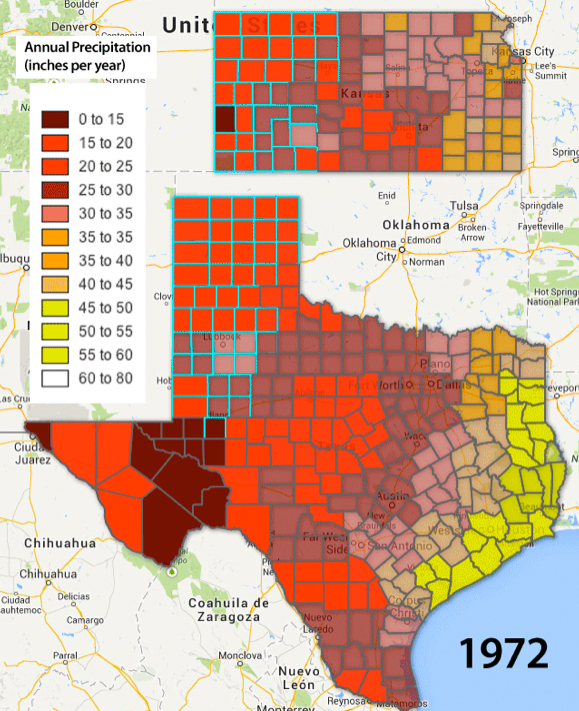
Infographic: Ogallala Precipitation in Motion — 72 Years Animated GIF (1940 – 2012)
0 Comments
/
When layered, maps of annual precipitation in Texas and Kansas show the stark moisture division in the United States between the wet East and the dry West running through the Great Plains.
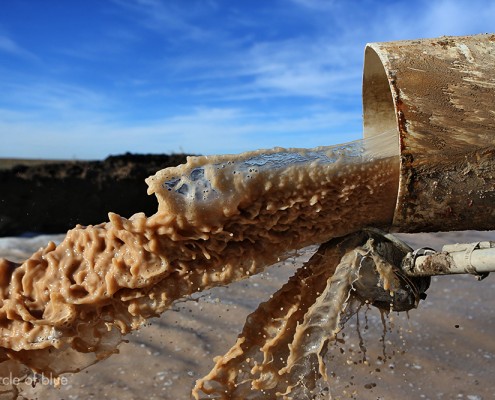
Failed Ballot Measure Is Setback for Ogallala Water Conservation in Western Kansas
A plan to reduce water use by 20 percent was voted down last…
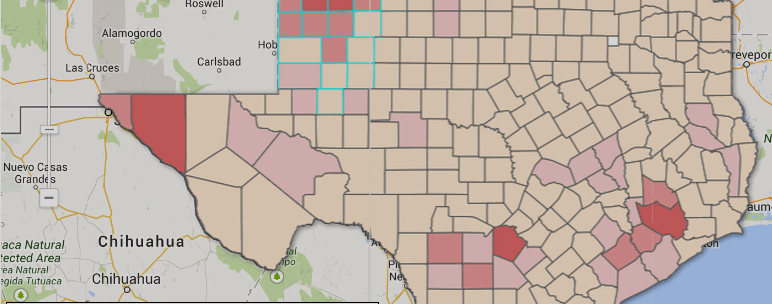
Map: Kansas and Texas Fresh Groundwater Use (1985-2005)
Click through the interactive Google Fusion Tables infographic to see how water use has changed over the last two decades, as well as how these trends relate to fluctuation of groundwater tables within the Ogallala Aquifer since the 1940s.
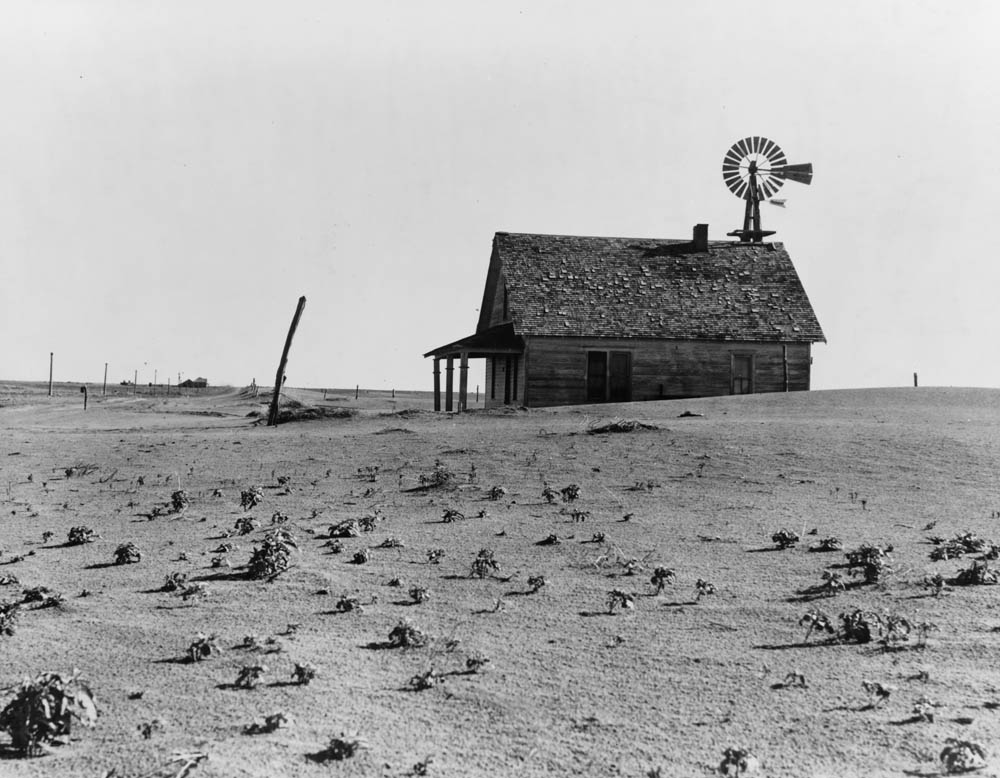
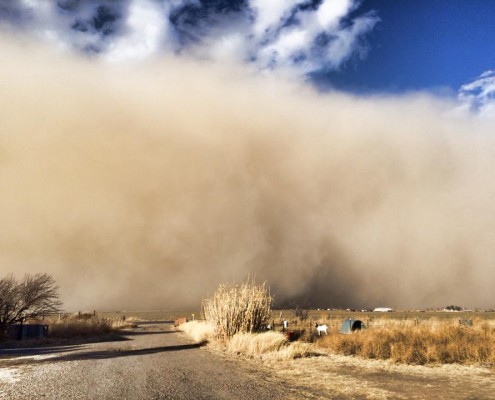
Slideshow: Drought in the Southern U.S. Plains Today Recalls the 1930s Dust Bowl
Strong winds and dry soils are a frightful combination.
The…
Ogallala Water Use Climbs as Drought Intensifies in the Southern Plains
Rainfall deficit is worse than the 1930s Dust Bowl.
By…

Q & A: Julene Bair, Author of The Ogallala Road
Fancy machinery and irrigation systems that pull millions of…


