Posts
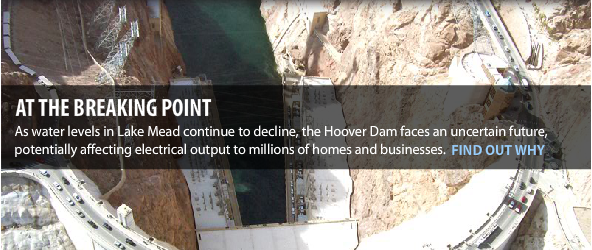
Infographic: Hoover Dam’s Troubled Waters
5 Comments
/
Completed in 1935, Hoover Dam supplies electricity to 29 million people in Arizona, California and Nevada.
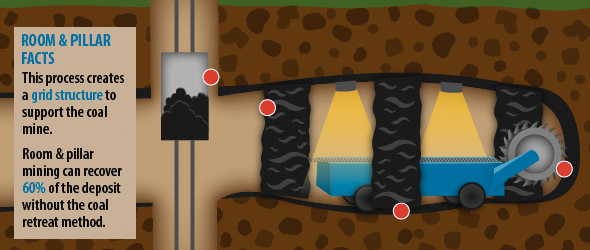
Infographic: Three Types of Coal Mining — Process and Facts
Opencast mining involves scraping at the ground's surface, while room and pillar mining occurs below ground. Likewise, longwall mining uses heavy machinery to dig at coal seams beneath the surface: learn more in this interactive inforgraphic.

Infographic: Biofuels 101 — Water Use from Plant to Power Source
Production of ethanol, the most commonly used biofuel, has prompted concerns about water use and food supply.
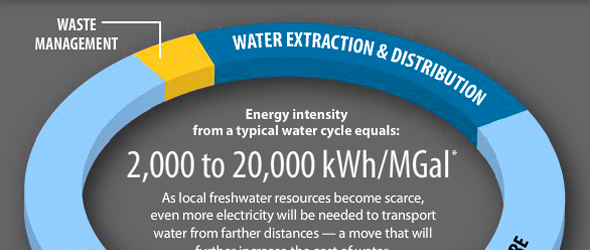
Infographic: Energy Used in the Water Cycle
At eight pounds per gallon, water is a heavy substance; especially when utilities move billions of gallons per day.
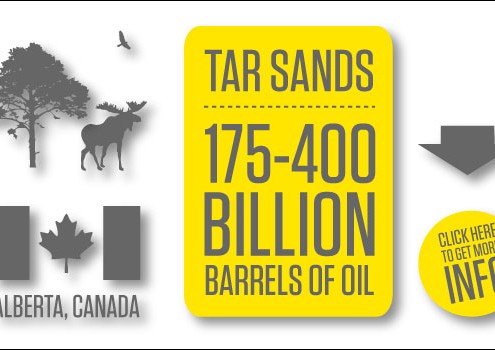
Infographic: A Closer Look at Tar Sands Oil
185 gallons of water + two tons of soil + 700-1200 cubic feet of natural gas
= one barrel of crude oil.
 https://www.circleofblue.org/wp-content/uploads/2010/09/Screen-Shot-2016-01-07-at-11.46.28-AM.png
418
575
Circle of Blue
https://www.circleofblue.org/wp-content/uploads/2018/06/Circle-of-Blue-Water-Speaks-600x139.png
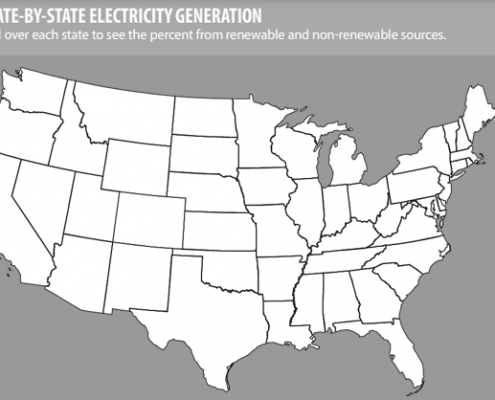
Circle of Blue2010-09-22 04:42:142016-01-05 07:08:29Infographic: U.S. Power Sources
Infographic: State Legislatures Bridge Water-Energy Gap
A look at 16 states with statutes that acknowledge the tightening chokepoint between declining water resources and rising energy demand.

Infographic: 10 Things You Should Know about Water + Energy
A survey of key water facts behind traditional and alternative energy sources.
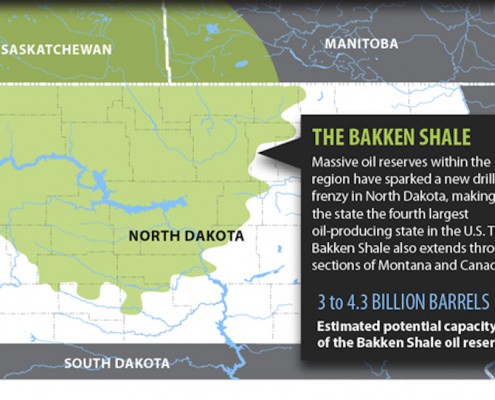
Infographic: North Dakota’s Rise To Domestic Oil Royalty
North Dakota has become the number four oil producing state—but at what cost to its water supply?

Photo Slideshow: Tar Sands Oil Refinery Burdens a Detroit Community
Residents face the environmental and health consequences of a Marathon refinery expansion.
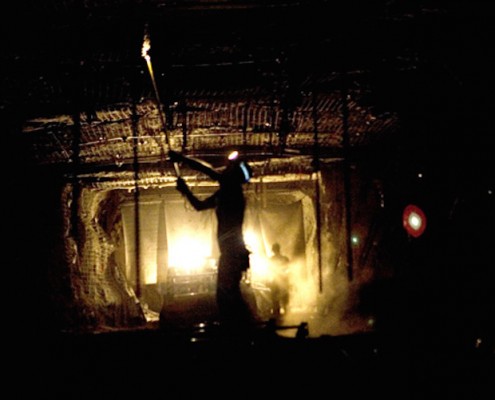
Photo Slideshow: A Desperate Clinch — Coal Production Across America
A look at the places and faces affected by coal production in the United States.
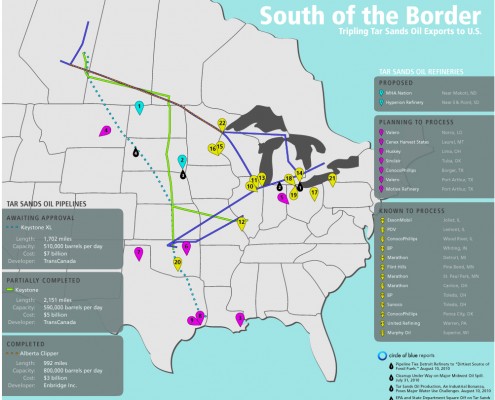
Infographic: Tripling Tar Sands Oil Imports, Pipeline and Refinery Map from Canada to U.S.
The industry is spending billions of dollars to develop more U.S. pipelines.


