Posts
 https://www.circleofblue.org/wp-content/uploads/2010/09/Screen-Shot-2016-01-07-at-11.46.28-AM.png
418
575
Circle of Blue
https://www.circleofblue.org/wp-content/uploads/2018/06/Circle-of-Blue-Water-Speaks-600x139.png
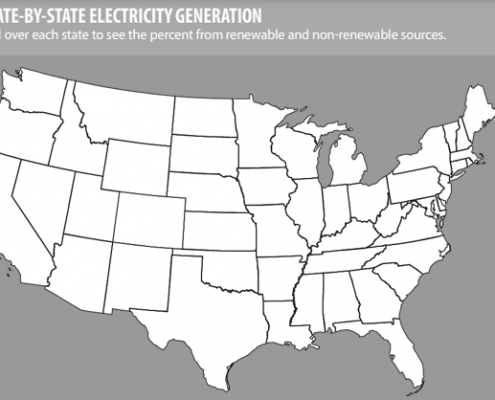
Circle of Blue2010-09-22 04:42:142016-01-05 07:08:29Infographic: U.S. Power Sources
Infographic: State Legislatures Bridge Water-Energy Gap
A look at 16 states with statutes that acknowledge the tightening chokepoint between declining water resources and rising energy demand.

Infographic: 10 Things You Should Know about Water + Energy
A survey of key water facts behind traditional and alternative energy sources.
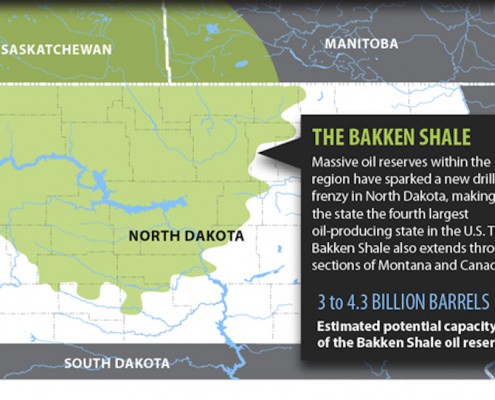
Infographic: North Dakota’s Rise To Domestic Oil Royalty
North Dakota has become the number four oil producing state—but at what cost to its water supply?
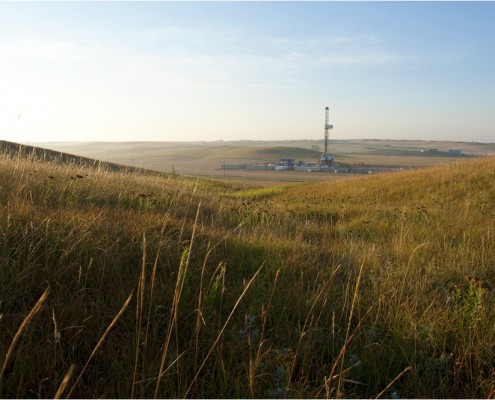
Water Demand is Flash Point in Dakota Oil Boom
Production from the Bakken Shale is projected to use up to 5.5 billion gallons of water annually.
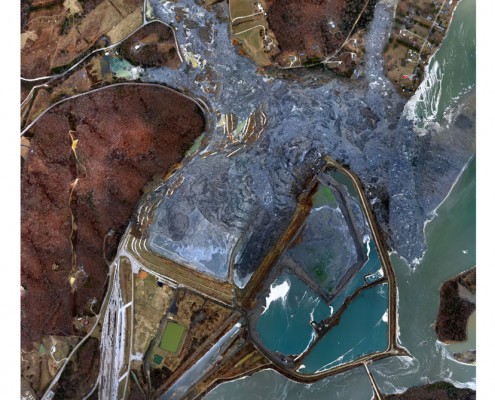
Coal Ash Contaminates Groundwater and Drinking Water Sites in 21 States, Study Finds
The EPA must do a better job of regulating the waste and protecting the nation’s water supply.
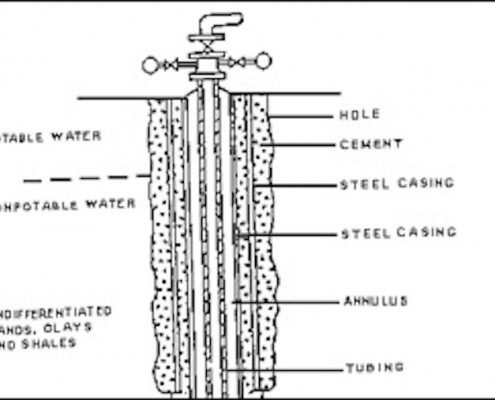
Government Warns Against Contaminated Water in Wyoming Town
Freshwater wells deemed unsafe because of hydrocarbons.
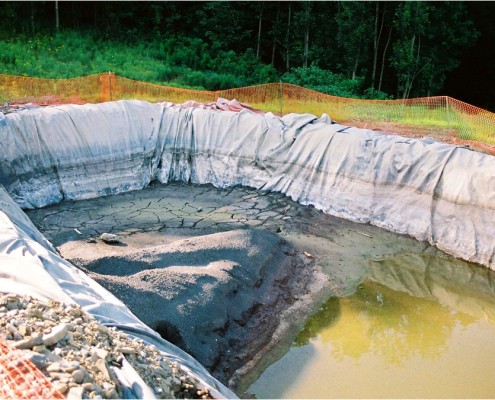
Fracking Regulations Vary Widely from State to State
A look at how states across America are facing deep frack dilemmas.

Photo Slideshow: Tar Sands Oil Refinery Burdens a Detroit Community
Residents face the environmental and health consequences of a Marathon refinery expansion.
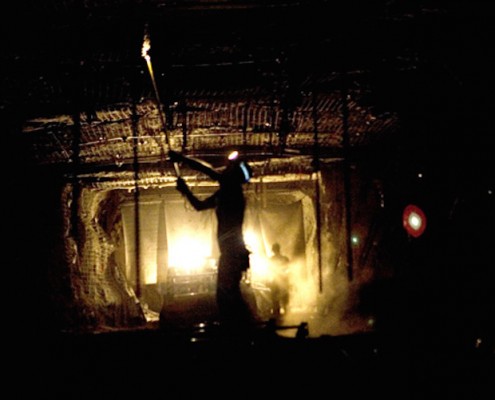
Photo Slideshow: A Desperate Clinch — Coal Production Across America
A look at the places and faces affected by coal production in the United States.
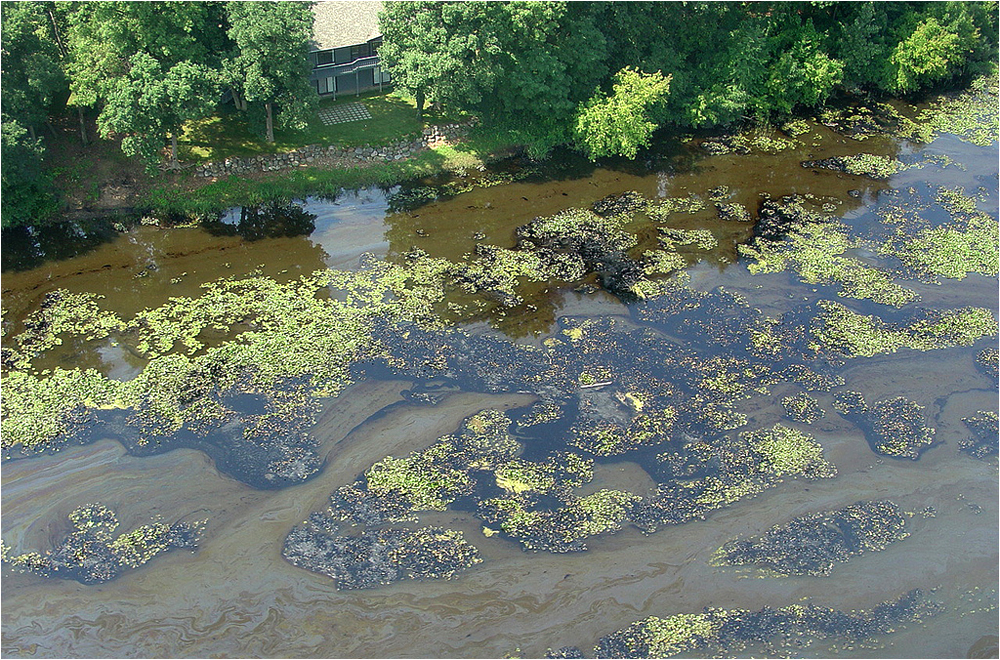
Scene of Midwest’s Worst Oil Spill – Sleepless Nights and Black Goo
Students examine communities affected by Enbridge rupture on Kalamzoo River.
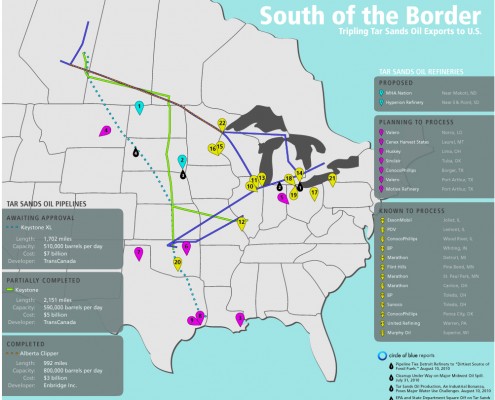
Infographic: Tripling Tar Sands Oil Imports, Pipeline and Refinery Map from Canada to U.S.
The industry is spending billions of dollars to develop more U.S. pipelines.

