Posts
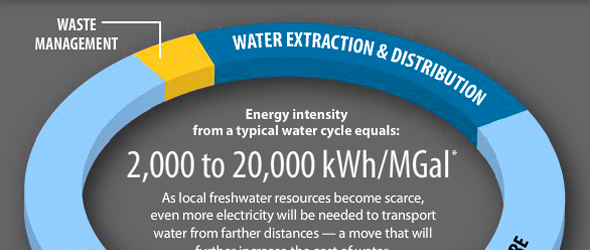
Infographic: Energy Used in the Water Cycle
0 Comments
/
At eight pounds per gallon, water is a heavy substance; especially when utilities move billions of gallons per day.
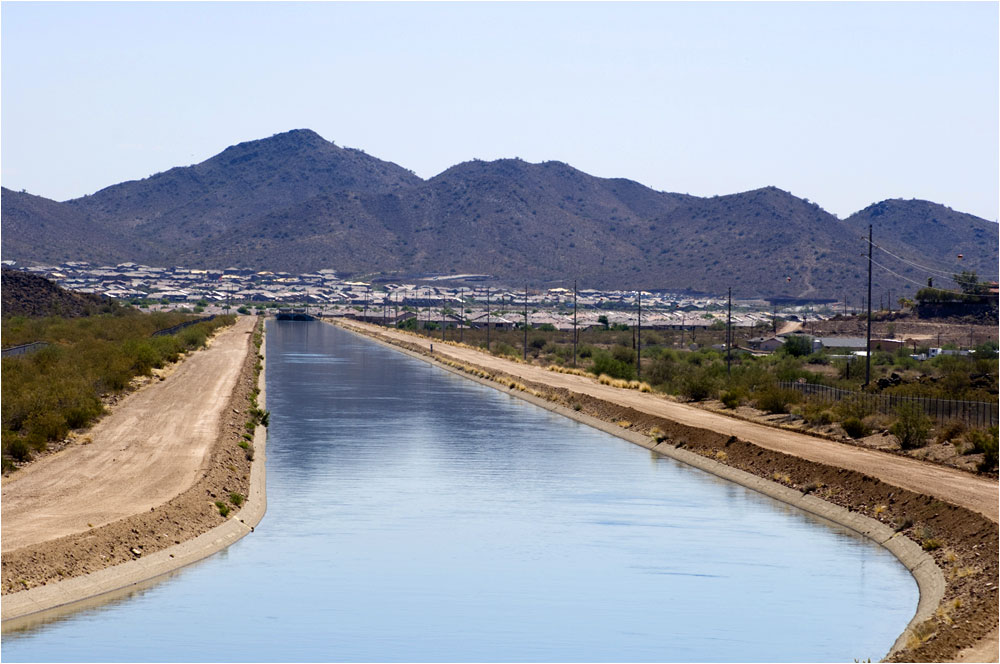
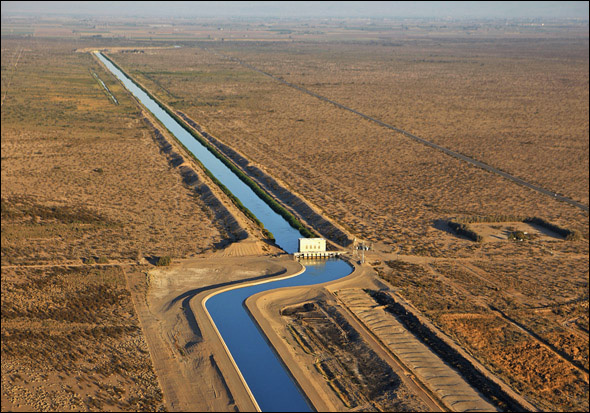
The Rising Cost of Settling the American Desert
Power plant that moves torrent of water uphill considers closing
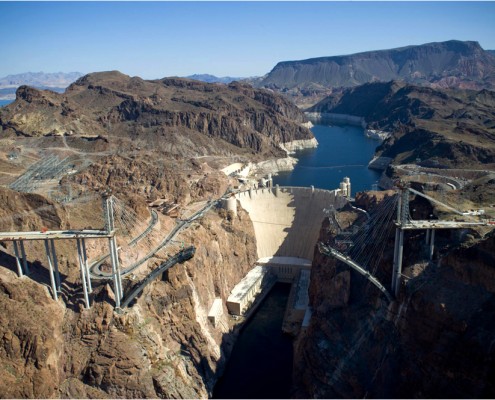
Low Water May Halt Hoover Dam’s Power
What happens if Lake Mead drops too low to generate electricity at Hoover Dam?
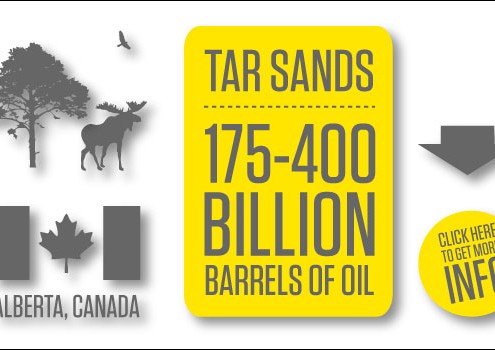
Infographic: A Closer Look at Tar Sands Oil
185 gallons of water + two tons of soil + 700-1200 cubic feet of natural gas
= one barrel of crude oil.
In Era of Climate Change and Water Scarcity, Meeting National Energy Demand Confronts Major Impediments
The pursuit of energy development development reveal gaps in policymaking.
 https://www.circleofblue.org/wp-content/uploads/2010/09/Screen-Shot-2016-01-07-at-11.46.28-AM.png
418
575
Circle of Blue
https://www.circleofblue.org/wp-content/uploads/2018/06/Circle-of-Blue-Water-Speaks-600x139.png
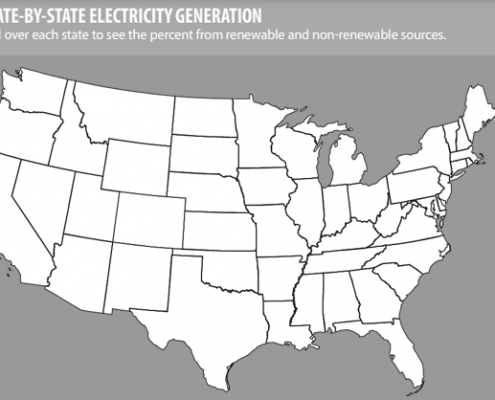
Circle of Blue2010-09-22 04:42:142016-01-05 07:08:29Infographic: U.S. Power Sources
Infographic: State Legislatures Bridge Water-Energy Gap
A look at 16 states with statutes that acknowledge the tightening chokepoint between declining water resources and rising energy demand.

Infographic: 10 Things You Should Know about Water + Energy
A survey of key water facts behind traditional and alternative energy sources.
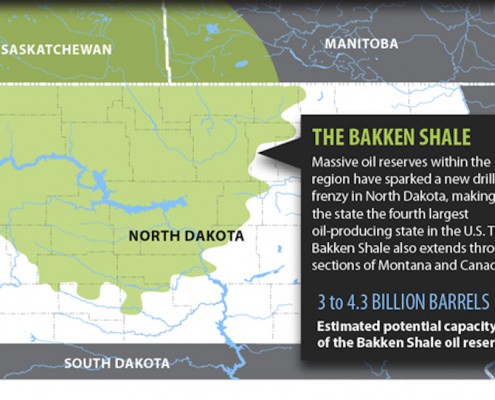
Infographic: North Dakota’s Rise To Domestic Oil Royalty
North Dakota has become the number four oil producing state—but at what cost to its water supply?
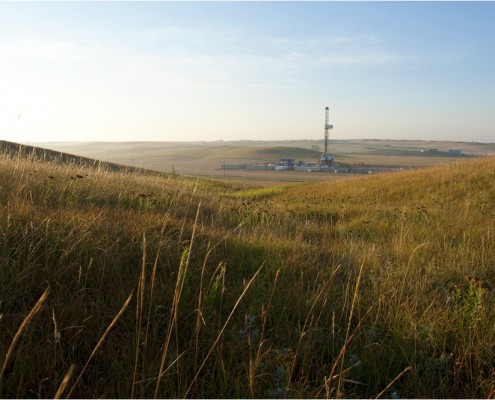
Water Demand is Flash Point in Dakota Oil Boom
Production from the Bakken Shale is projected to use up to 5.5 billion gallons of water annually.
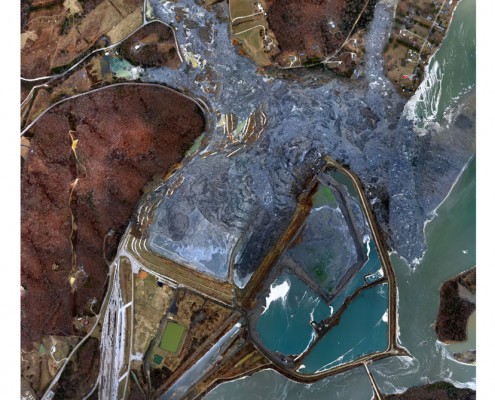
Coal Ash Contaminates Groundwater and Drinking Water Sites in 21 States, Study Finds
The EPA must do a better job of regulating the waste and protecting the nation’s water supply.
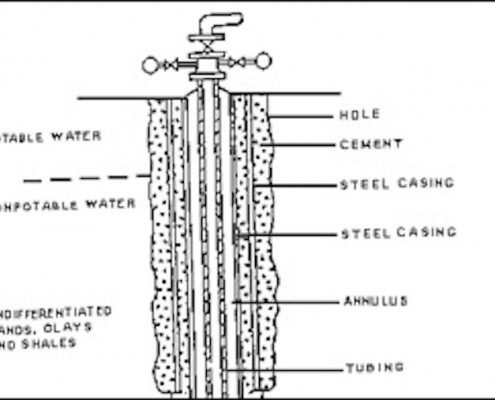
Government Warns Against Contaminated Water in Wyoming Town
Freshwater wells deemed unsafe because of hydrocarbons.

