Posts
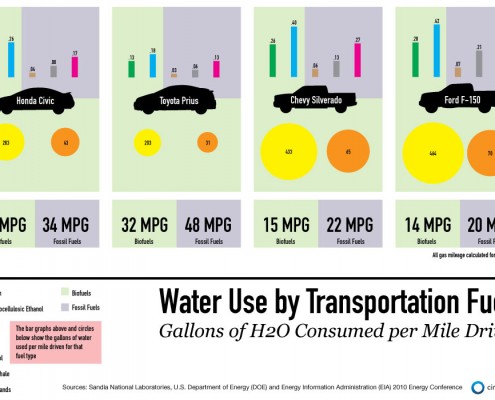
Infographic: Water Use Per Mile Driven — Biofuels vs. Fossil Fuels
0 Comments
/
A breakdown of gallons of water used by transportation fuels per mile.
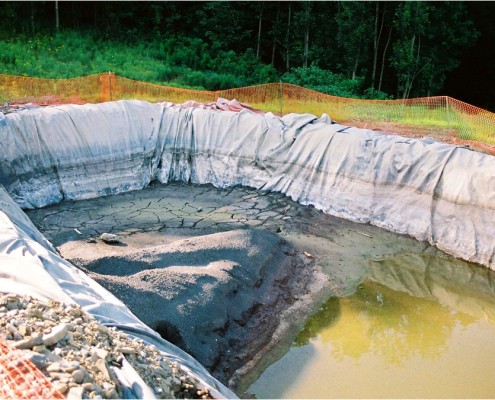
Fracking Regulations Vary Widely from State to State
A look at how states across America are facing deep frack dilemmas.
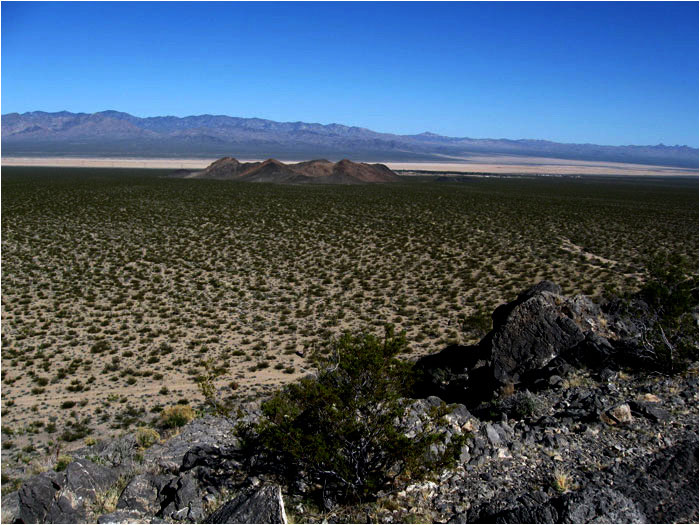
In Solar Power Lies Path to Reducing Water Use For Energy
California’s latest proposed desert solar power plant could compromise desert habitat.

Photo Slideshow: Tar Sands Oil Refinery Burdens a Detroit Community
Residents face the environmental and health consequences of a Marathon refinery expansion.
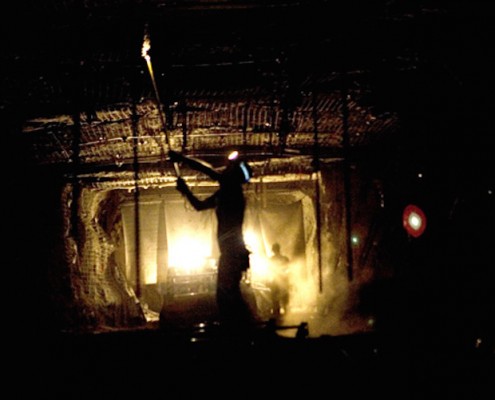
Photo Slideshow: A Desperate Clinch — Coal Production Across America
A look at the places and faces affected by coal production in the United States.
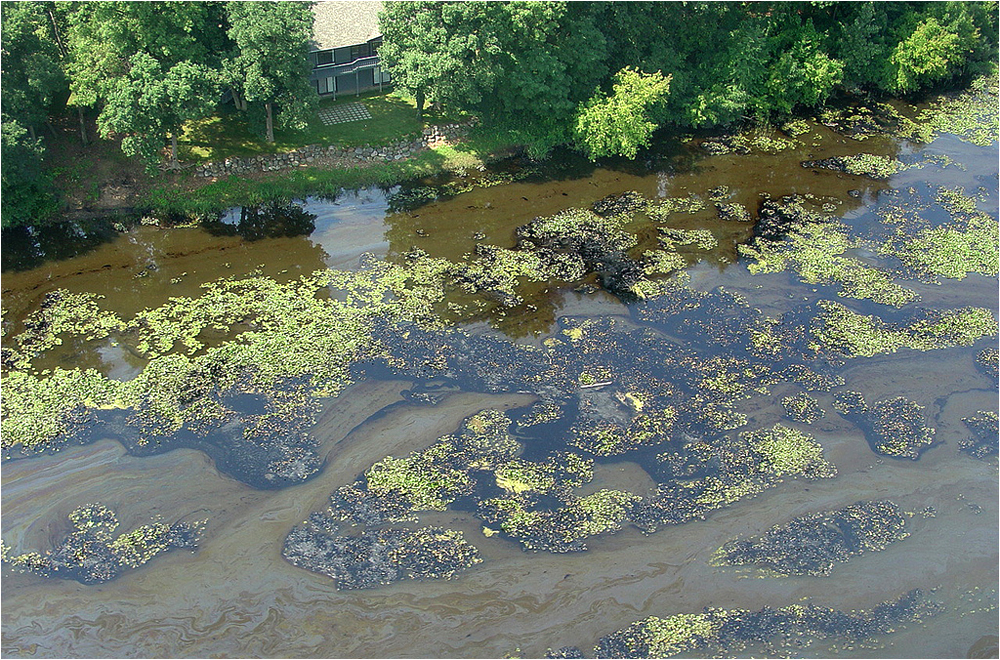
Scene of Midwest’s Worst Oil Spill – Sleepless Nights and Black Goo
Students examine communities affected by Enbridge rupture on Kalamzoo River.
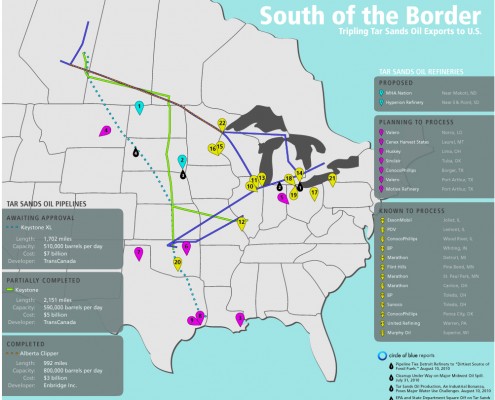
Infographic: Tripling Tar Sands Oil Imports, Pipeline and Refinery Map from Canada to U.S.
The industry is spending billions of dollars to develop more U.S. pipelines.
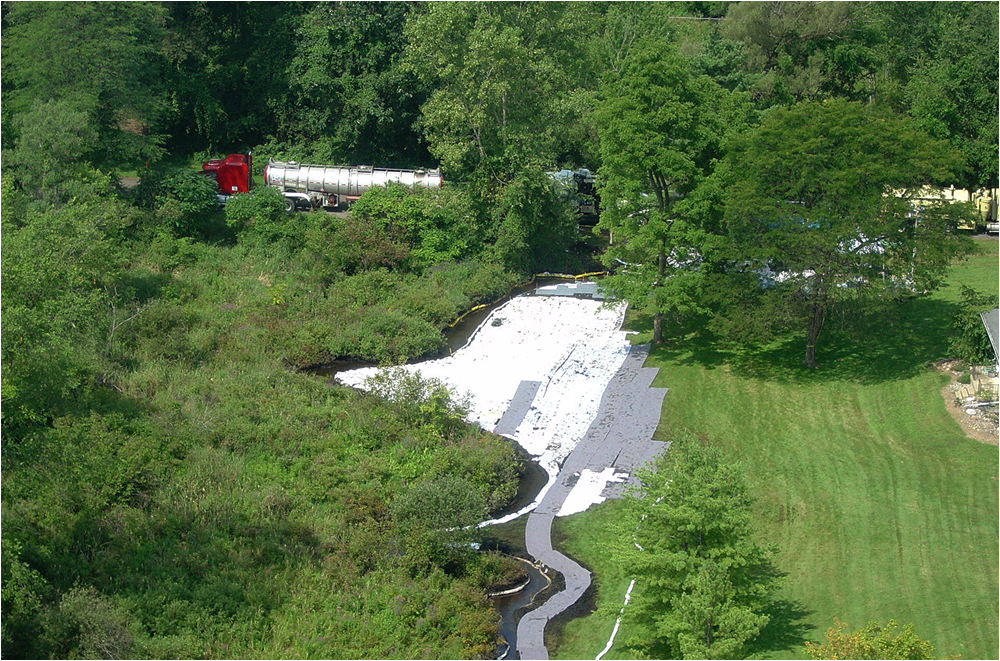
A Midwest Pipeline Rupture Raises Questions About Tar Sands Risk
Enbridge is working overtime to clean up the spill, placate the community, and get oil flowing again.
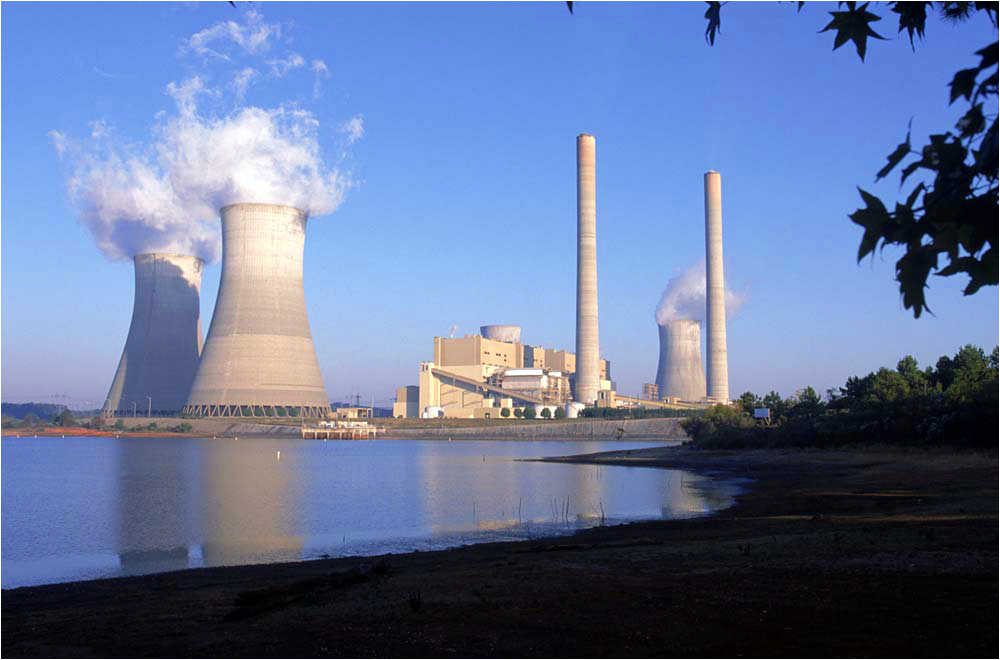
Water Scarcity Prompts Different Plans to Reckon With U.S. Energy Choke Point
Southeast could learn from Southwest
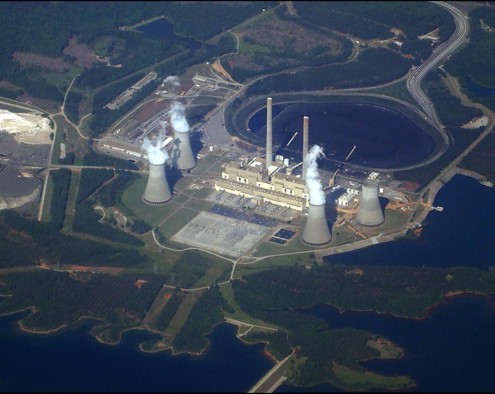
Thermal Power Stations Need Makeover
Utilities feel pressure from more users and less water.
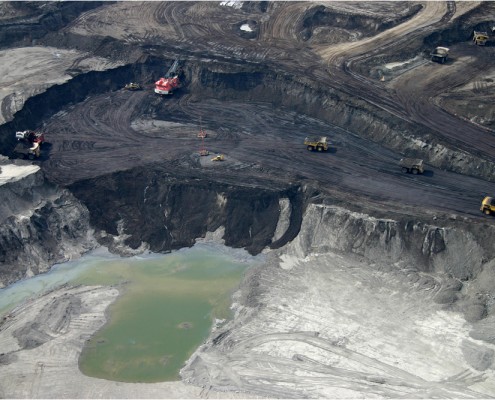
EPA and State Department Square Off On Tar Sands Pipeline
Water use and greenhouse gas emissions are major concerns with oil interests plays.
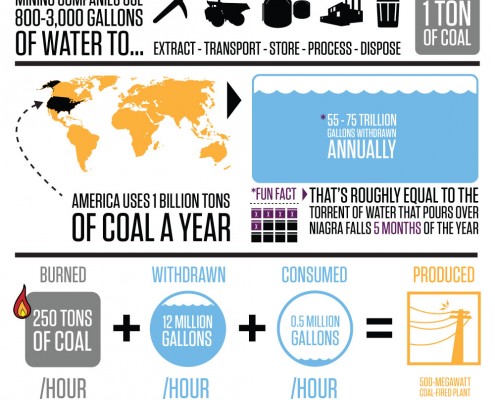
Infographic: Coal and Water – A Resource Mismatch
The contest between coal-fired energy production and water demand is a mismatch.

