
Posts
 https://www.circleofblue.org/wp-content/uploads/2017/07/2015-0220150206-Ariz-CAP-JGanter-Filename-471-2500.jpg
1058
2048
Brett Walton
https://www.circleofblue.org/wp-content/uploads/2018/06/Circle-of-Blue-Water-Speaks-600x139.png
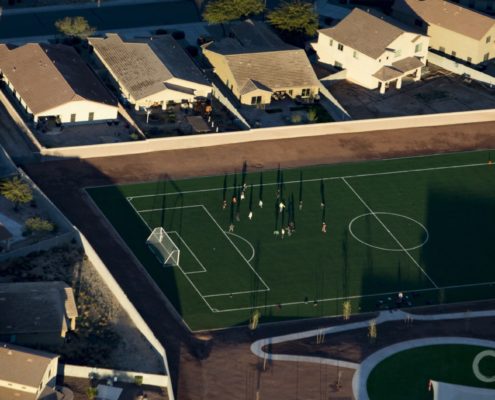
Brett Walton2017-07-14 13:01:382022-05-12 18:36:15Saving Water Lowered Rates in Two Arizona Cities
https://www.circleofblue.org/wp-content/uploads/2017/07/2015-0220150206-Ariz-CAP-JGanter-Filename-471-2500.jpg
1058
2048
Brett Walton
https://www.circleofblue.org/wp-content/uploads/2018/06/Circle-of-Blue-Water-Speaks-600x139.png
Brett Walton2017-07-14 13:01:382022-05-12 18:36:15Saving Water Lowered Rates in Two Arizona Cities https://www.circleofblue.org/wp-content/uploads/2017/05/CapeTown.jpg
1152
2048
Brett Walton
https://www.circleofblue.org/wp-content/uploads/2018/06/Circle-of-Blue-Water-Speaks-600x139.png
Brett Walton2017-05-30 05:00:482018-01-26 09:47:23To Avoid Drought Calamity, Cape Town Restricts Water Use
https://www.circleofblue.org/wp-content/uploads/2017/05/CapeTown.jpg
1152
2048
Brett Walton
https://www.circleofblue.org/wp-content/uploads/2018/06/Circle-of-Blue-Water-Speaks-600x139.png
Brett Walton2017-05-30 05:00:482018-01-26 09:47:23To Avoid Drought Calamity, Cape Town Restricts Water Use https://www.circleofblue.org/wp-content/uploads/2016/04/2016-04-Michigan-Infrastructure-TVC-JCGanter_5125-2500.jpg
880
1600
Brett Walton
https://www.circleofblue.org/wp-content/uploads/2018/06/Circle-of-Blue-Water-Speaks-600x139.png
Brett Walton2016-04-25 06:30:112016-04-25 14:53:00Study: Efficient Fixtures Cut U.S. Indoor Water Use
https://www.circleofblue.org/wp-content/uploads/2016/04/2016-04-Michigan-Infrastructure-TVC-JCGanter_5125-2500.jpg
880
1600
Brett Walton
https://www.circleofblue.org/wp-content/uploads/2018/06/Circle-of-Blue-Water-Speaks-600x139.png
Brett Walton2016-04-25 06:30:112016-04-25 14:53:00Study: Efficient Fixtures Cut U.S. Indoor Water Use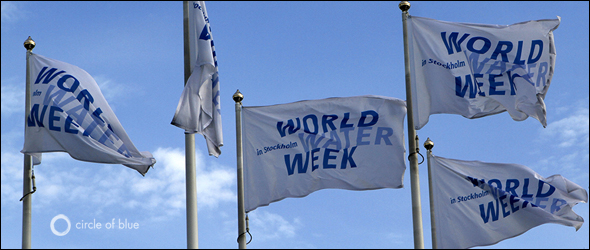 https://www.circleofblue.org/wp-content/uploads/2011/08/water-news-world-water-590.jpg
250
590
Circle of Blue
https://www.circleofblue.org/wp-content/uploads/2018/06/Circle-of-Blue-Water-Speaks-600x139.png
Circle of Blue2011-08-26 13:52:302012-02-15 01:35:03Stockholm World Water Week 2011: Megacities, Human Rights, Sanitation, Tech Tools, Energy, and Food
https://www.circleofblue.org/wp-content/uploads/2011/08/water-news-world-water-590.jpg
250
590
Circle of Blue
https://www.circleofblue.org/wp-content/uploads/2018/06/Circle-of-Blue-Water-Speaks-600x139.png
Circle of Blue2011-08-26 13:52:302012-02-15 01:35:03Stockholm World Water Week 2011: Megacities, Human Rights, Sanitation, Tech Tools, Energy, and Food https://www.circleofblue.org/wp-content/uploads/2018/06/Circle-of-Blue-Water-Speaks-600x139.png
0
0
Nadya Ivanova
https://www.circleofblue.org/wp-content/uploads/2018/06/Circle-of-Blue-Water-Speaks-600x139.png
Nadya Ivanova2011-08-23 08:00:242011-08-23 05:08:49The Stream, August 23: If the Yangtze River Runs Dry
https://www.circleofblue.org/wp-content/uploads/2018/06/Circle-of-Blue-Water-Speaks-600x139.png
0
0
Nadya Ivanova
https://www.circleofblue.org/wp-content/uploads/2018/06/Circle-of-Blue-Water-Speaks-600x139.png
Nadya Ivanova2011-08-22 08:00:582011-08-21 23:01:44The Stream, August 22: World Water Week 2011
https://www.circleofblue.org/wp-content/uploads/2018/06/Circle-of-Blue-Water-Speaks-600x139.png
0
0
Nadya Ivanova
https://www.circleofblue.org/wp-content/uploads/2018/06/Circle-of-Blue-Water-Speaks-600x139.png
Nadya Ivanova2011-07-06 08:00:492011-07-04 06:52:08The Stream, July 6: Climate Change and Security
https://www.circleofblue.org/wp-content/uploads/2018/06/Circle-of-Blue-Water-Speaks-600x139.png
0
0
Nadya Ivanova
https://www.circleofblue.org/wp-content/uploads/2018/06/Circle-of-Blue-Water-Speaks-600x139.png
Nadya Ivanova2011-08-23 08:00:242011-08-23 05:08:49The Stream, August 23: If the Yangtze River Runs Dry
https://www.circleofblue.org/wp-content/uploads/2018/06/Circle-of-Blue-Water-Speaks-600x139.png
0
0
Nadya Ivanova
https://www.circleofblue.org/wp-content/uploads/2018/06/Circle-of-Blue-Water-Speaks-600x139.png
Nadya Ivanova2011-08-22 08:00:582011-08-21 23:01:44The Stream, August 22: World Water Week 2011
https://www.circleofblue.org/wp-content/uploads/2018/06/Circle-of-Blue-Water-Speaks-600x139.png
0
0
Nadya Ivanova
https://www.circleofblue.org/wp-content/uploads/2018/06/Circle-of-Blue-Water-Speaks-600x139.png
Nadya Ivanova2011-07-06 08:00:492011-07-04 06:52:08The Stream, July 6: Climate Change and Security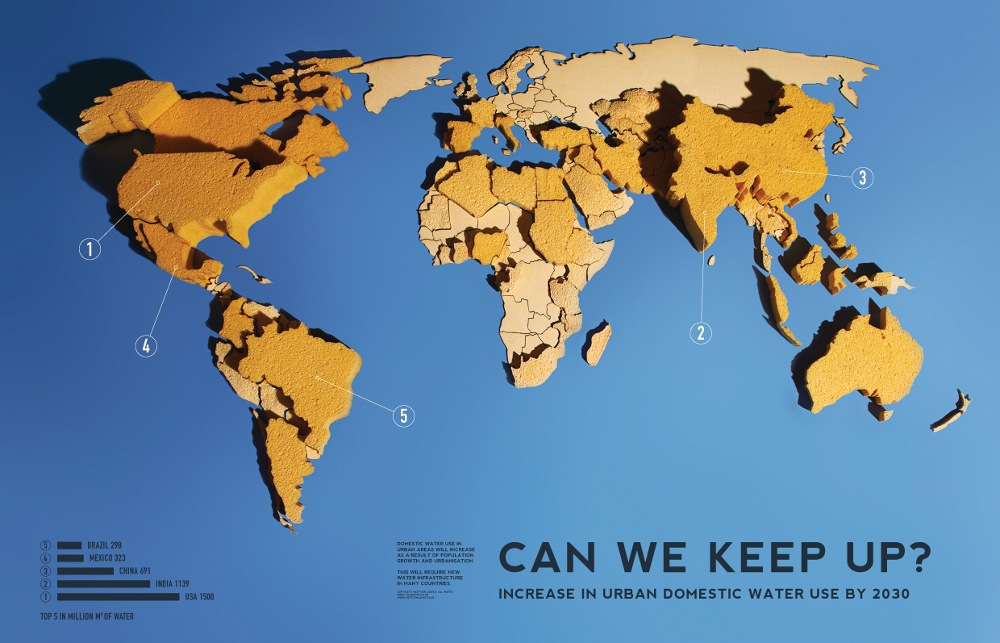 https://www.circleofblue.org/wp-content/uploads/2011/03/Urban_Water_Design_Challenge_Runner_Up1.jpg
643
1000
Circle of Blue
https://www.circleofblue.org/wp-content/uploads/2018/06/Circle-of-Blue-Water-Speaks-600x139.png
Circle of Blue2011-03-29 09:21:212011-03-31 14:58:32Infographic: Can We Keep Up? Increase in Urban Domestic Water Use by 2030
https://www.circleofblue.org/wp-content/uploads/2011/03/Urban_Water_Design_Challenge_Runner_Up1.jpg
643
1000
Circle of Blue
https://www.circleofblue.org/wp-content/uploads/2018/06/Circle-of-Blue-Water-Speaks-600x139.png
Circle of Blue2011-03-29 09:21:212011-03-31 14:58:32Infographic: Can We Keep Up? Increase in Urban Domestic Water Use by 2030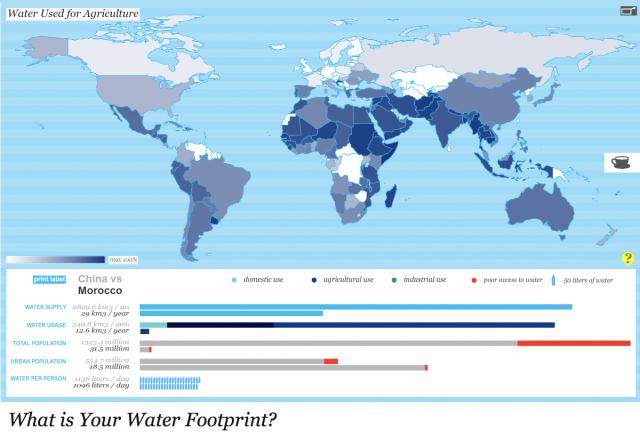 https://www.circleofblue.org/wp-content/uploads/2011/03/waterfootprint.jpg
438
640
Circle of Blue
https://www.circleofblue.org/wp-content/uploads/2018/06/Circle-of-Blue-Water-Speaks-600x139.png
Circle of Blue2011-03-25 16:04:152011-03-31 14:59:19Harvard Students Win Urban Water Design Challenge for Interactive Water Footprint Infographic
https://www.circleofblue.org/wp-content/uploads/2018/06/Circle-of-Blue-Water-Speaks-600x139.png
0
0
Nadya Ivanova
https://www.circleofblue.org/wp-content/uploads/2018/06/Circle-of-Blue-Water-Speaks-600x139.png
Nadya Ivanova2011-03-23 08:01:402011-03-22 22:38:42The Stream, March 23: World Water Ranking
https://www.circleofblue.org/wp-content/uploads/2011/03/chinas-five-year-plan-infographic.jpg
250
590
Circle of Blue
https://www.circleofblue.org/wp-content/uploads/2018/06/Circle-of-Blue-Water-Speaks-600x139.png
Circle of Blue2011-03-15 14:00:372016-04-27 22:47:23Infographic: Successes and Failures of China’s Five-Year Plans (1996 -2010)
https://www.circleofblue.org/wp-content/uploads/2018/06/Circle-of-Blue-Water-Speaks-600x139.png
0
0
Nadya Ivanova
https://www.circleofblue.org/wp-content/uploads/2018/06/Circle-of-Blue-Water-Speaks-600x139.png
Nadya Ivanova2009-03-31 13:08:352009-04-01 23:07:02Dry Spell Sabotages Arusha’s Rainy Season
https://www.circleofblue.org/wp-content/uploads/2011/03/waterfootprint.jpg
438
640
Circle of Blue
https://www.circleofblue.org/wp-content/uploads/2018/06/Circle-of-Blue-Water-Speaks-600x139.png
Circle of Blue2011-03-25 16:04:152011-03-31 14:59:19Harvard Students Win Urban Water Design Challenge for Interactive Water Footprint Infographic
https://www.circleofblue.org/wp-content/uploads/2018/06/Circle-of-Blue-Water-Speaks-600x139.png
0
0
Nadya Ivanova
https://www.circleofblue.org/wp-content/uploads/2018/06/Circle-of-Blue-Water-Speaks-600x139.png
Nadya Ivanova2011-03-23 08:01:402011-03-22 22:38:42The Stream, March 23: World Water Ranking
https://www.circleofblue.org/wp-content/uploads/2011/03/chinas-five-year-plan-infographic.jpg
250
590
Circle of Blue
https://www.circleofblue.org/wp-content/uploads/2018/06/Circle-of-Blue-Water-Speaks-600x139.png
Circle of Blue2011-03-15 14:00:372016-04-27 22:47:23Infographic: Successes and Failures of China’s Five-Year Plans (1996 -2010)
https://www.circleofblue.org/wp-content/uploads/2018/06/Circle-of-Blue-Water-Speaks-600x139.png
0
0
Nadya Ivanova
https://www.circleofblue.org/wp-content/uploads/2018/06/Circle-of-Blue-Water-Speaks-600x139.png
Nadya Ivanova2009-03-31 13:08:352009-04-01 23:07:02Dry Spell Sabotages Arusha’s Rainy Season

