Posts

The Stream, December 21: Some Relief for Mississippi
0 Comments
/
The Washington Post reports that rain, runoff from the season's…

The Stream, September 11: Great Lakes Week and Reframing the Climate Debate
Great Lakes Week
Great Lakes Week 2012 kicked off yesterday…

The Stream, August 23: The Struggle for Safe Drinking Water
This photo slideshow demonstrates the effects of coal extraction…

The Stream, July 19: Pricing, Pollution and a Warming Planet
Regulatory measures
The Clean Water Act has largely fallen short…

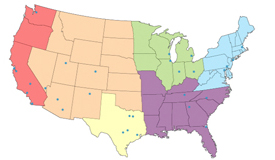
Map: 2012 Water Prices in 30 Major U.S. Cities
The price that Americans pay for water is rising faster than the cost of any other utility service in the United States — be it gas, electricity, or telephone charges.

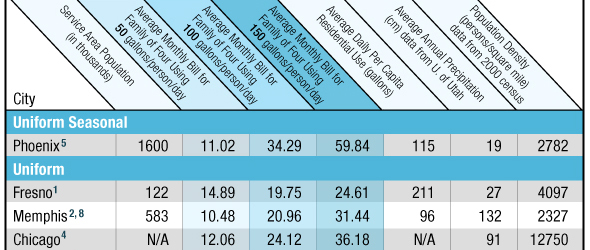
Infographic: 2010, 2011, and 2012 Water Pricing Survey for 30 Major U.S. Cities
The price of water can be influenced by the supply sources and systems, in addition to the number of users who are sharing these water resources and the burden to pay for the supply system's maintenance.

The Stream, February 16: Uruguay to Begin Onshore Oil and Gas Exploration
Uruguay has signed a contract with U.S. company Schuepbach Energy…

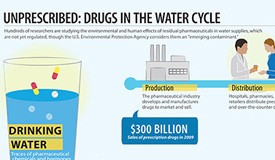
Infographic: Unprescribed — Drugs in the Water Cycle
In 2009, 3.9 billion prescriptions were dispensed in the United States, and an estimated 10 to 40 percent of medicines are not used. With 78 million baby boomers reaching the age when prescription drug use will increase, how will this affect environmental and drinking water?

The Stream, November 2: Weather Extremes Will Worsen
Costly weather extremes such as drought and floods are becoming…

Peter Gleick and Phaedra Ellis-Lamkins: Jobs and Water for America
Every year, our old water infrastructure spills 860 million gallons of untreated waste into America’s waterways, including raw or partially treated sewage, bacteria, parasites, synthetic hormones, pharmaceuticals, and agricultural wastes.

2011 is Record-setting Year for Climate Change: Ice Melts in Arctic, High Temps in U.S.
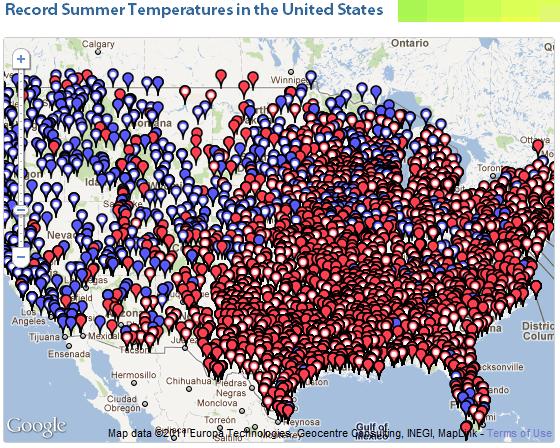
A new study has revealed that ice volume in the Arctic Sea reached an all-time low in 2010. Meanwhile, in the United States, more high-temperature records have been set this summer than in any other year previously, as well as many regions that have broken rainfall and drought records.

The Stream, September 9: U.S. Temperature Records
Summer 2011 saw more warm temperature records tied or broken…


