Posts
The Price of Water: A Comparison of Water Rates, Usage in 30 U.S. Cities
49 Comments
/
"For more than 20 years industry has been moving south looking for cheaper labor, I'm hoping that now they'll start coming back looking for cheaper water."
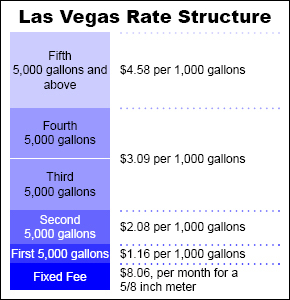
U.S. Urban Residents Cut Water Usage; Utilities are Forced to Raise Prices
In too many American cities to count, water consumers are dramatically reducing the amount they use only to be hit with higher water rates.
U.S. water usage by state on Google Earth
Using United States Geological Survey data from the most recent…
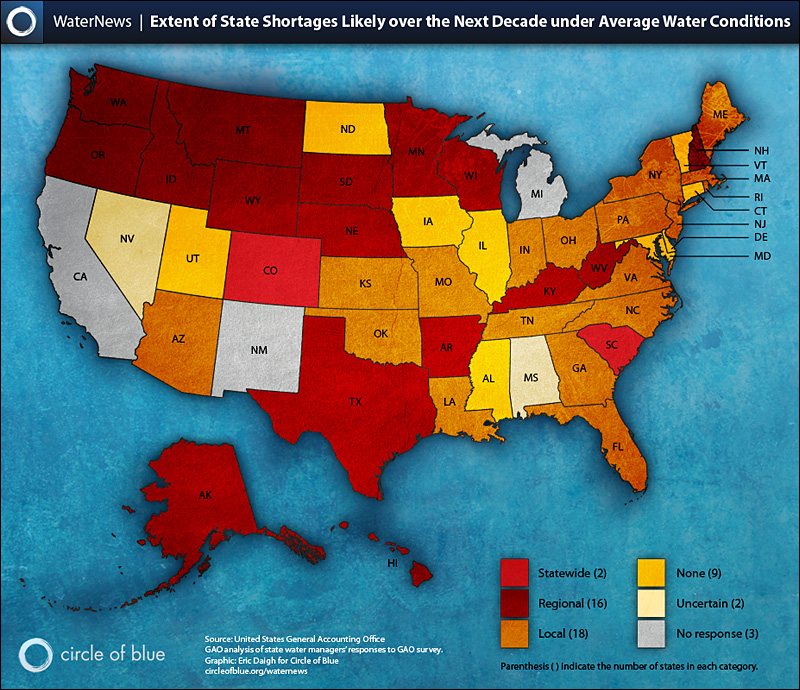
Infographic: U.S. Water Shortage Forecast — 2013 Prediction Map
The extent of state shortages likely over the next decade under…
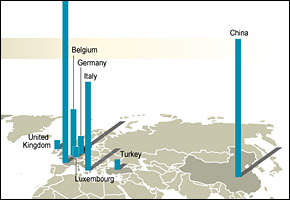
Infographic: Bottled Water Imports and Exports
A new UN map highlights bottled water's patterns of international…
Infographic: All the Water in the World – Circles of Blue
A diagram, by Circle of Blue, illustrating just how little freshwater…

Infographic: All the Water in the World – Circles of Blue
A diagram, by Circle of Blue, illustrating just how little freshwater…
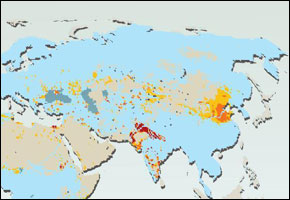
UN map shows unsustainable agriculture irrigation worldwide
Unsustainable water withdrawals for irrigation on every continent…
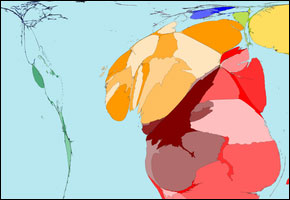 https://www.circleofblue.org/wp-content/uploads/2008/03/worldmapper_cholera.jpg
200
290
Circle of Blue
https://www.circleofblue.org/wp-content/uploads/2018/06/Circle-of-Blue-Water-Speaks-600x139.png
Circle of Blue2008-03-19 10:56:182008-03-19 10:57:17Worldwide Cholera Cases

Check your water footprint
You may be surprised to see how much water is used to produce…

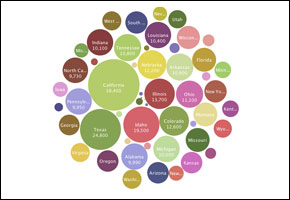
Infographic: U.S. Water Use by State
A visualization of water use by U.S. state in the year 2000.
See…


