
Posts
 https://www.circleofblue.org/wp-content/uploads/2011/03/Urban_Water_Design_Challenge_Runner_Up1.jpg
643
1000
Circle of Blue
https://www.circleofblue.org/wp-content/uploads/2018/06/Circle-of-Blue-Water-Speaks-600x139.png
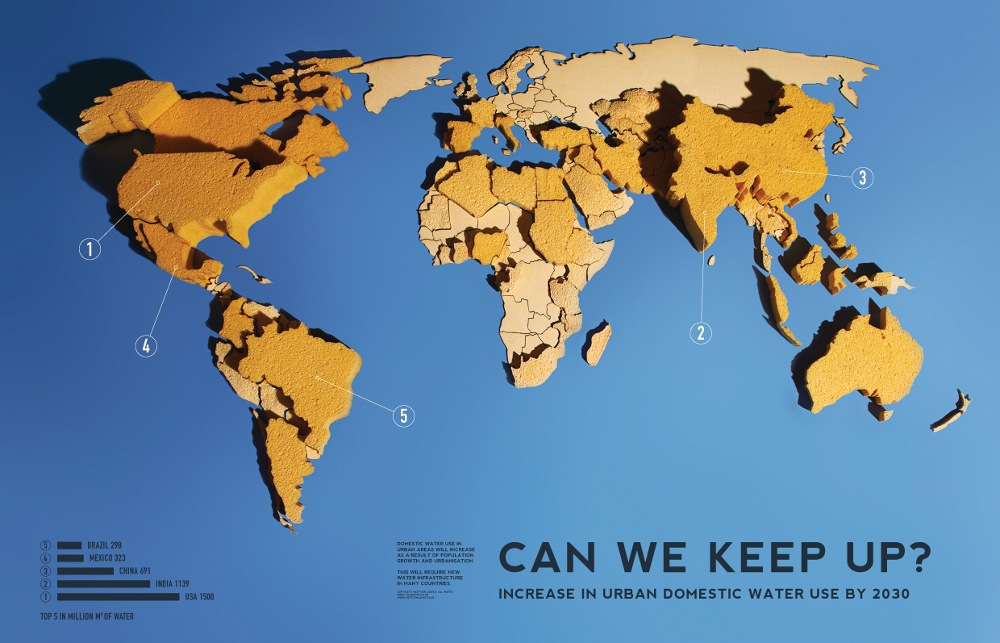
Circle of Blue2011-03-29 09:21:212011-03-31 14:58:32Infographic: Can We Keep Up? Increase in Urban Domestic Water Use by 2030
https://www.circleofblue.org/wp-content/uploads/2011/03/Urban_Water_Design_Challenge_Runner_Up1.jpg
643
1000
Circle of Blue
https://www.circleofblue.org/wp-content/uploads/2018/06/Circle-of-Blue-Water-Speaks-600x139.png
Circle of Blue2011-03-29 09:21:212011-03-31 14:58:32Infographic: Can We Keep Up? Increase in Urban Domestic Water Use by 2030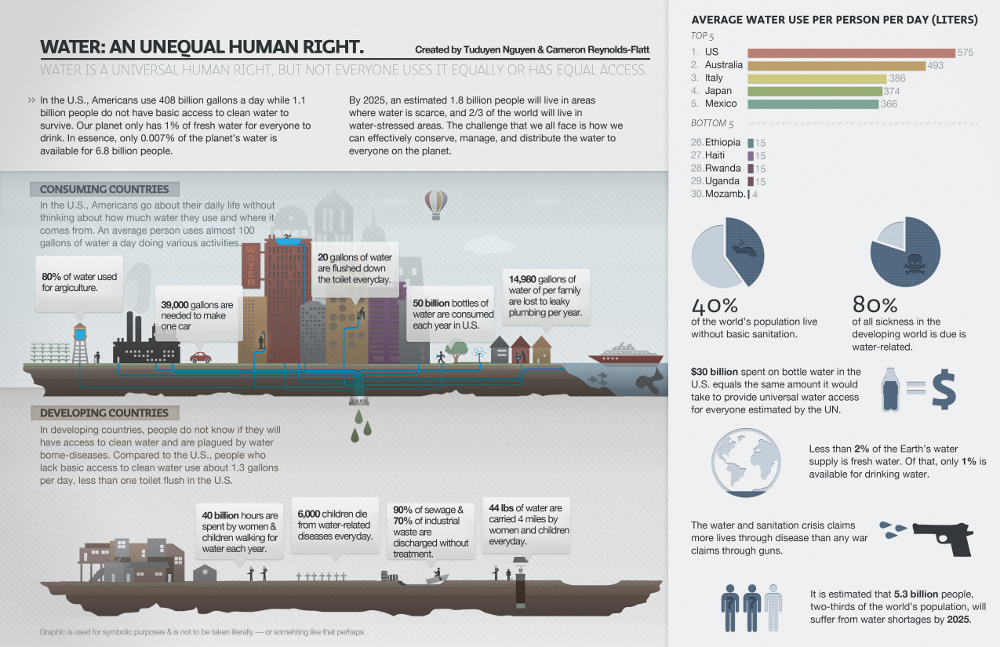 https://www.circleofblue.org/wp-content/uploads/2011/03/Urban_Water_Design_Challenge_Runner_Up2.jpg
647
1000
Circle of Blue
https://www.circleofblue.org/wp-content/uploads/2018/06/Circle-of-Blue-Water-Speaks-600x139.png
Circle of Blue2011-03-29 09:08:122011-03-31 14:58:43Infographic: Water – An Unequal Human Right
https://www.circleofblue.org/wp-content/uploads/2011/03/Urban_Water_Design_Challenge_Runner_Up2.jpg
647
1000
Circle of Blue
https://www.circleofblue.org/wp-content/uploads/2018/06/Circle-of-Blue-Water-Speaks-600x139.png
Circle of Blue2011-03-29 09:08:122011-03-31 14:58:43Infographic: Water – An Unequal Human Right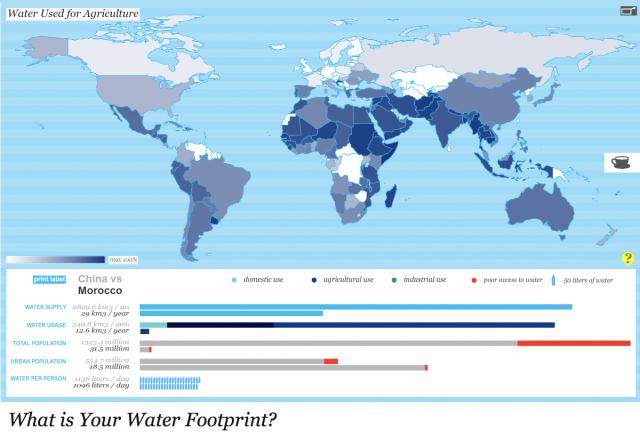 https://www.circleofblue.org/wp-content/uploads/2011/03/waterfootprint.jpg
438
640
Circle of Blue
https://www.circleofblue.org/wp-content/uploads/2018/06/Circle-of-Blue-Water-Speaks-600x139.png
Circle of Blue2011-03-25 16:04:152011-03-31 14:59:19Harvard Students Win Urban Water Design Challenge for Interactive Water Footprint Infographic
https://www.circleofblue.org/wp-content/uploads/2011/03/waterfootprint.jpg
438
640
Circle of Blue
https://www.circleofblue.org/wp-content/uploads/2018/06/Circle-of-Blue-Water-Speaks-600x139.png
Circle of Blue2011-03-25 16:04:152011-03-31 14:59:19Harvard Students Win Urban Water Design Challenge for Interactive Water Footprint Infographic

