Posts
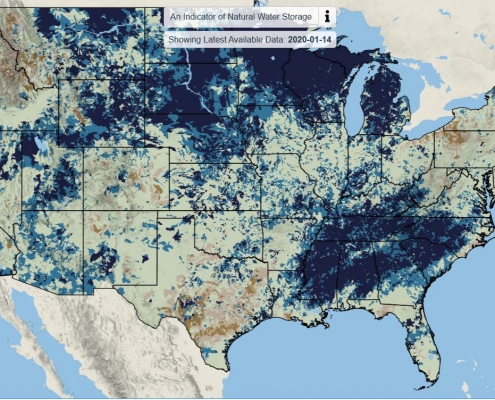
U.S. Water Data, Refreshed Daily
0 Comments
/
New U.S. Geological Survey tool displays where water is – and isn’t – in the Lower 48 states.
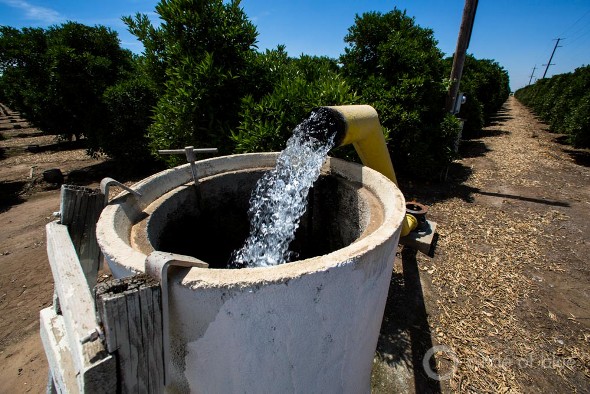
Groundwater Data Bill Passes California Senate
Lawmakers seek to make public a trove of groundwater data.

California Farms Use How Much Water? Nobody Really Knows
No comprehensive data exist on agricultural water consumption.
Risk Assessment Tool Puts a Price on Water Scarcity
The Water Risk Monetizer guides corporate investments where water…

U.S. Government Builds a Home for Water Data
The Open Water Data Initiative wants a common house for real-time U.S. water information. But this could take decades.

Two NASA Satellite Missions Fill Gaps in Water Knowledge: 2014 Preview, Part II
From soil to stratosphere, scientific understanding of the water cycle will take a giant leap in 2014.

Draft USGS Water Strategy Collides With Tough Budget Situation
Some key programs identified in the draft, which was released…
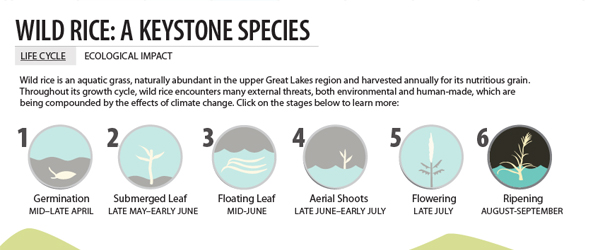
Infographic: Wild Rice is Keystone Species for Upper Great Lakes Region
Wild Rice is an aquatic grass that is harvested annually for…
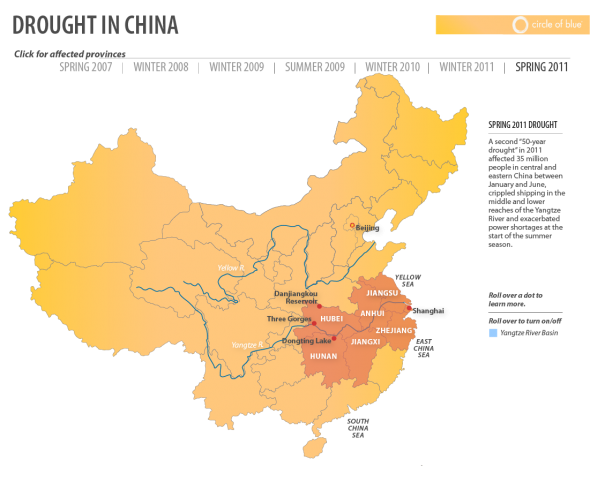
Infographic: Interactive Timeline Mapping China’s Drought-ridden Provinces Since 2007
Water scarcity is becoming an increasingly persistent problem…
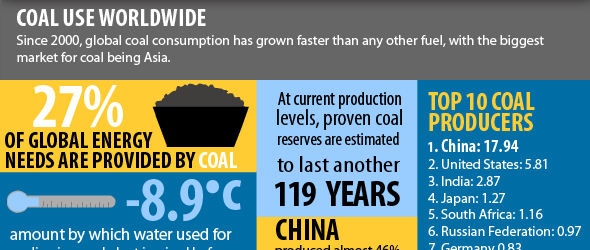
Infographic: China Leads Top 10 Coal Producing and Consuming Nations
Since 2000, global coal consumption has grown faster than any other fuel, with the biggest market for coal in Asia. Although China tops the global list for both coal consumption and production, the nation has emerged as the world's leading builder of clean coal technology.
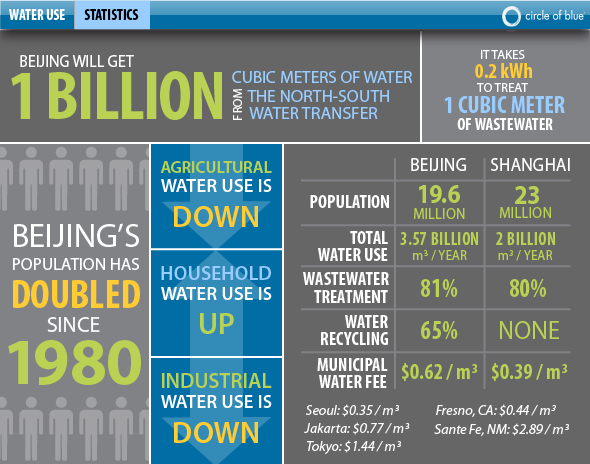
Infographic: Beijing Water Use and Population Statistics
The population of China's capital has doubled since 1980, and, though agricultural and industrial water use is down, municipal use is up.

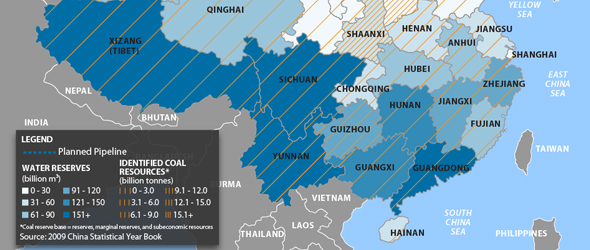
Infographic: Bohai Pipeline Map — Coal Reserves vs. Water Resources in Northern China
A look at China's coal-rich, yet water-scarce northern region.


