Posts
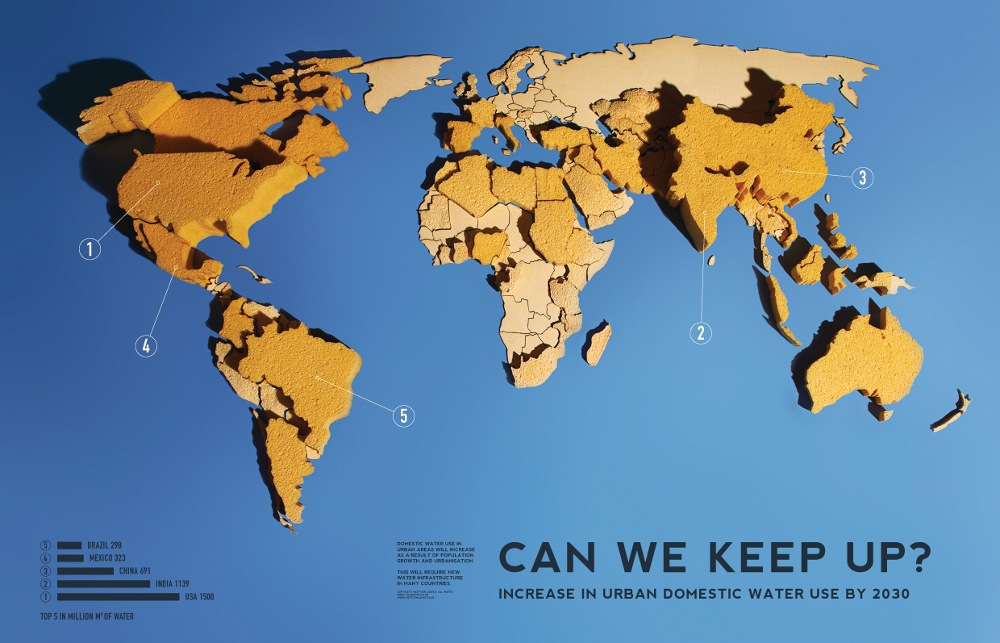
Infographic: Can We Keep Up? Increase in Urban Domestic Water Use by 2030
2 Comments
/
Runner-up in the 2011 Urban Water Design Challenge, sponsored by Visualizing.org and Circle of Blue.
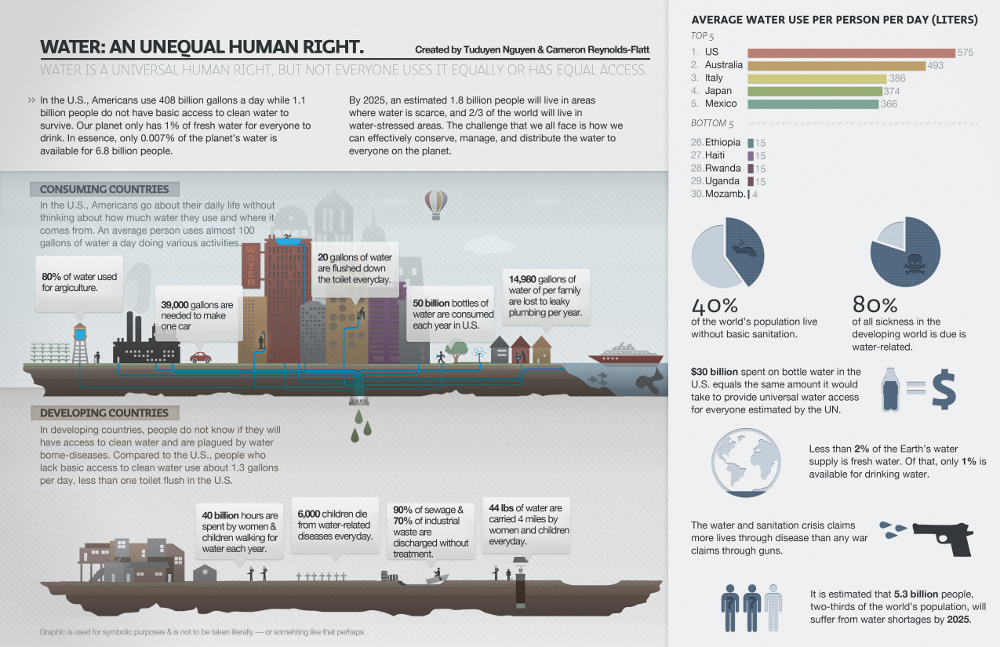
Infographic: Water – An Unequal Human Right
Runner-up in the 2011 Urban Water Design Challenge, sponsored by Visualizing.org and Circle of Blue.
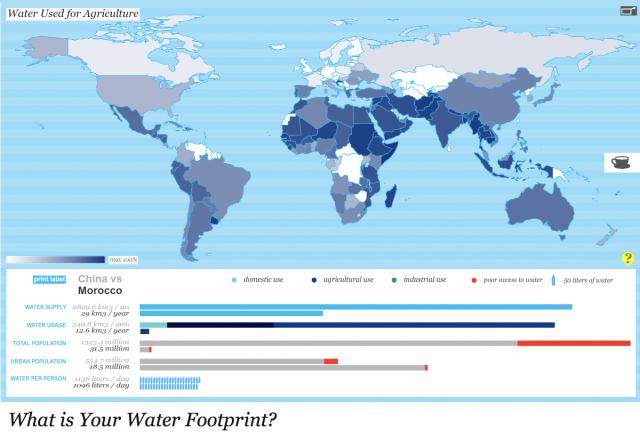
Harvard Students Win Urban Water Design Challenge for Interactive Water Footprint Infographic
Three weeks, 36 entries: Global competition sponsored by Circle of Blue and Visualizing.org.

Infographic: Successes and Failures of China’s Five-Year Plans (1996 -2010)
A breakdown of previous plans gives context to the newly released 12th Five-Year Plan.
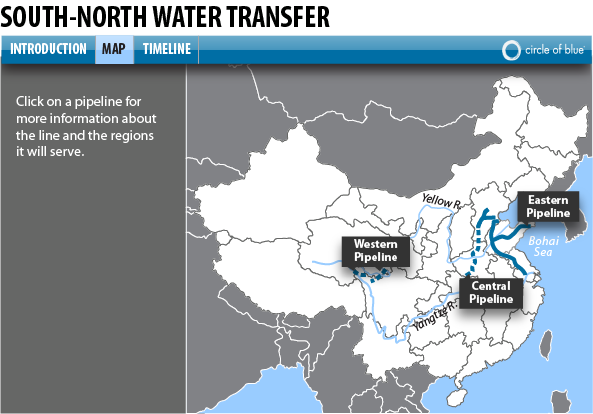
Infographic: China’s South-North Water Transfer Project
Authorities close to the central government say the western line will be built.
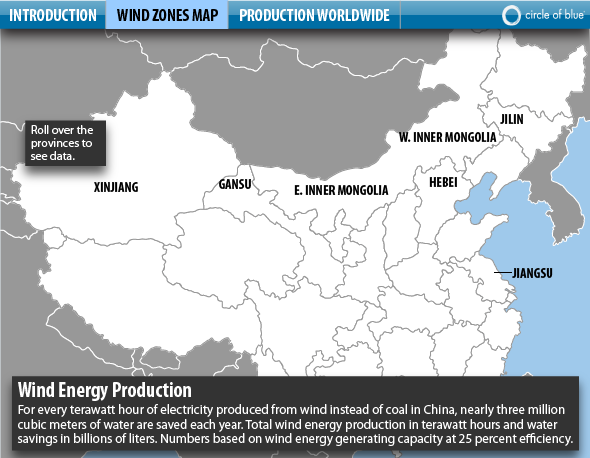
Infographic: China’s Wind Energy Sector is Global Leader
Wind generating capacity in China has reached more than 42 GW—the most of any country.
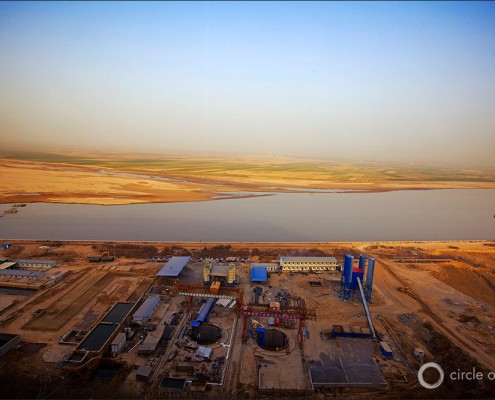
Choke Point: China – Confronting Water Scarcity and Energy Demand in the World’s Largest Country
An escalating confrontation over resources; a confrontation with global implications.
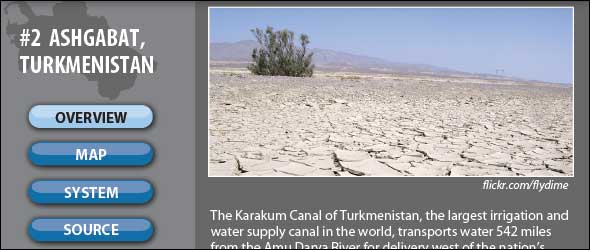
Infographic: Going the Distance, From Ashgabat to Whyalla—10 Cities Pumping Water From Afar
In many cities, water travels far to reach the tap. Residents of the planet's driest places rely on extensive waterways to deliver their supply. Click through the interactive infographic below to learn more about 10 cities that pipe water in from distant aquifers, plus additional plans to expand waterway networks even further.
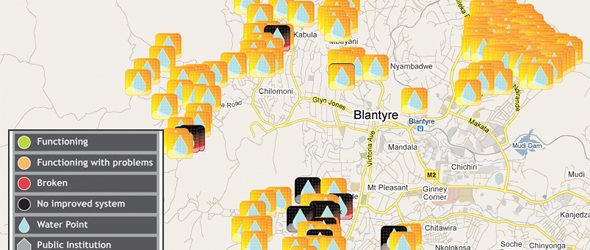
Do It and Prove It—Information Technology Opens Up the Water Sector
Organizations are creating tech tools to shine light on water supply operations—and improve service.
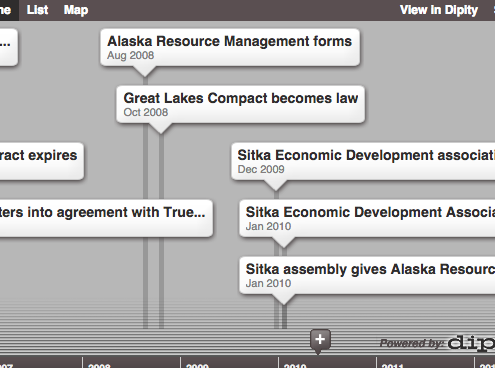
Timeline: North American Bulk Water Sales
Bulk water has been attempted and banned around the world. Visualize the last decade of attempts in Sitka.

2009 California Water Plan Published
Report recommends upgrading the state's information base to better user understanding of the water system.
 https://www.circleofblue.org/wp-content/uploads/2009/07/craterlake.jpg
200
290
Cody Pope
https://www.circleofblue.org/wp-content/uploads/2018/06/Circle-of-Blue-Water-Speaks-600x139.png
Cody Pope2009-07-31 21:42:482015-02-12 11:23:27Infographic: Top 10 Deepest Freshwater Lakes in the World


