Posts
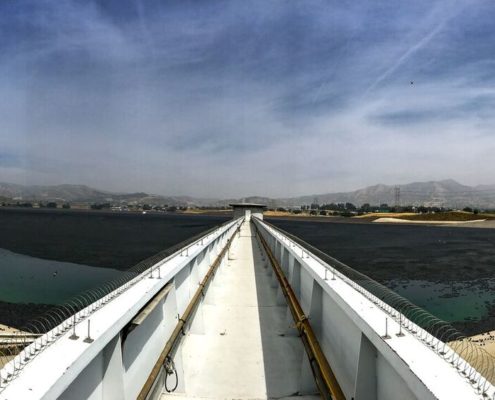
Price of Water 2018: Utilities Revise Household Water Rate Formulas
11 Comments
/
Small increase in prices but some significant adjustments to water bill calculations.
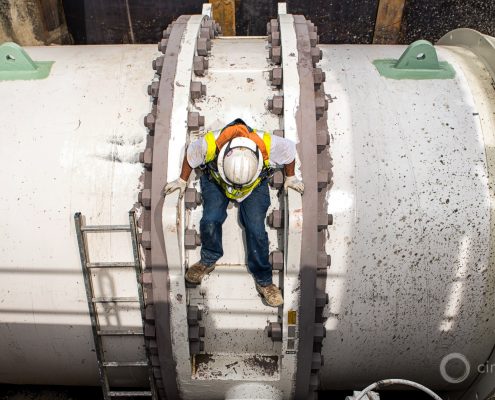
Price of Water 2017: Four Percent Increase in 30 Large U.S. Cities
Utilities test new rates, look beyond the ratepayer for revenue.
 https://www.circleofblue.org/wp-content/uploads/2016/06/2016-04-Michigan-Infrastructure-TVC-JCGanter_5067-2500.jpg
1667
2500
Brett Walton
https://www.circleofblue.org/wp-content/uploads/2018/06/Circle-of-Blue-Water-Speaks-600x139.png
Brett Walton2016-05-18 11:31:312017-05-18 13:22:39Price of Water 2016: Up 5 Percent in 30 Major U.S. Cities; 48 Percent Increase Since 2010
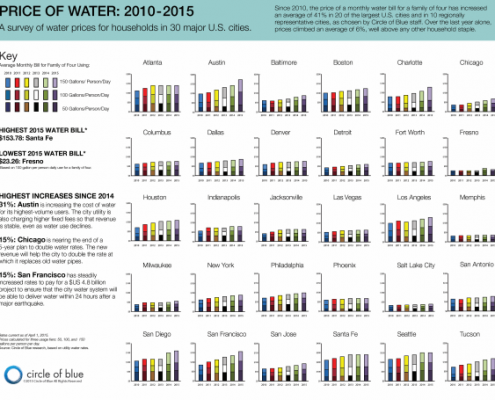
Infographic: Price of Water in 30 Major U.S. Cities (2010-2015)
Cities raise rates to pay for repairs and to respond to conservation.
The…
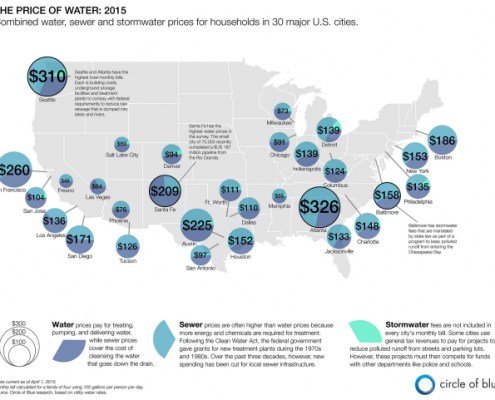
Infographic: 2015 Price of U.S. Water, Sewer, and Stormwater
Map of the cost of water service in 30 major U.S. cities.
The…
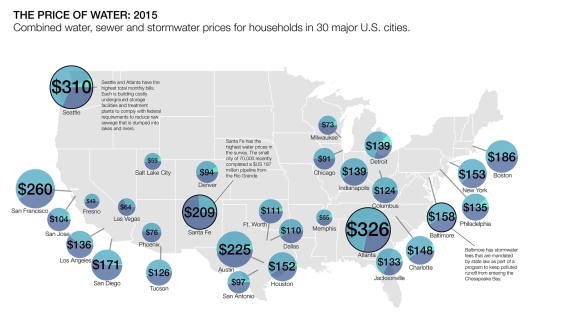
Price of Water 2015: Up 6 Percent in 30 Major U.S. Cities; 41 Percent Rise Since 2010
As urban water use declines, utilities change business models.
Graphic…
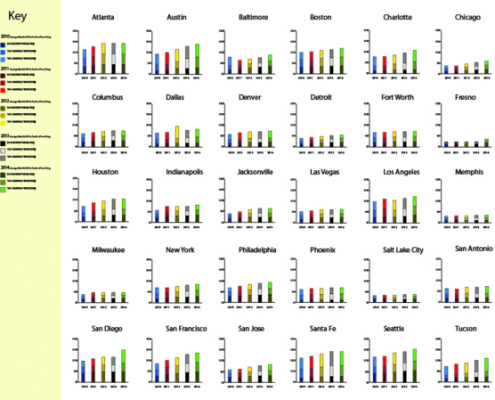
Price of Water 2014: Up 6 Percent in 30 Major U.S. Cities; 33 Percent Rise Since 2010
Water scarcity and successful conservation programs force…
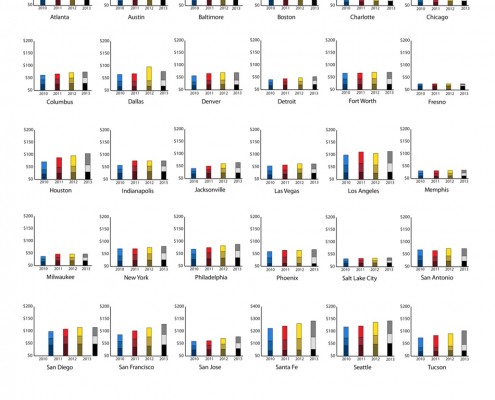
The Price of Water 2013: Up Nearly 7 Percent in Last Year in 30 Major U.S. Cities; 25 Percent Rise Since 2010
Utilities tinker with rate structures designed to stabilize revenue.
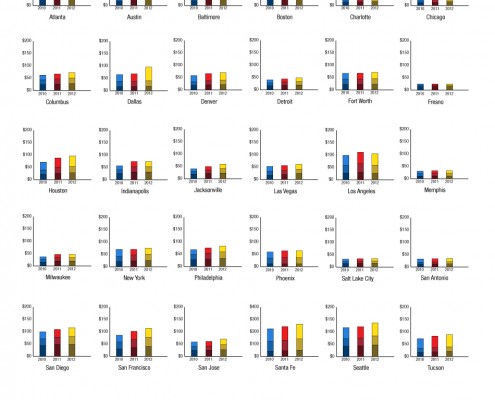
The Price of Water 2012: 18 Percent Rise Since 2010, 7 Percent Over Last Year in 30 Major U.S. Cities
Rates have increased in many cities, but local conditions dictate by how much and how the increase is distributed. Chicago prices are up nearly 25 percent, while Los Angeles is down by 9 percent.
The Price of Water 2011: Prices Rise an Average of 9 Percent in Major U.S. Cities
Because of costlier inputs and infrastructure replacement, rate experts predict prices will only go higher.
The Price of Water: A Comparison of Water Rates, Usage in 30 U.S. Cities
"For more than 20 years industry has been moving south looking for cheaper labor, I'm hoping that now they'll start coming back looking for cheaper water."


