Posts

Infographic: How Desalination Works
1 Comment
/
What is the process, and how much energy does it take? This video describes two common methods—reverse osmosis and flash distillation—for obtaining water from the sea.
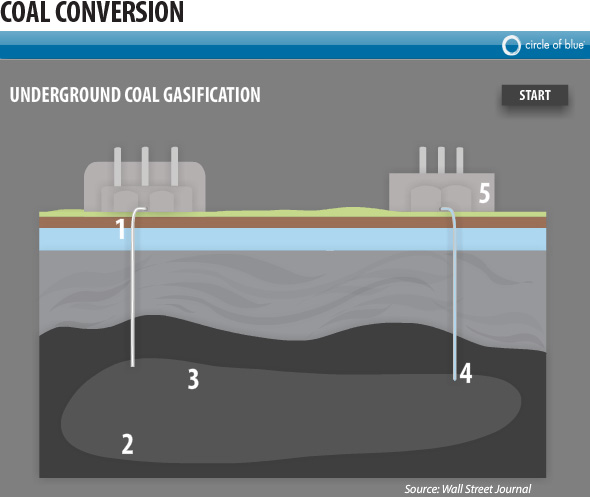
Infographic: Underground Coal Conversion — Creating Fuels and Fertilizers with Less Water
Though the chemistry and industrial processes for coal gasification…
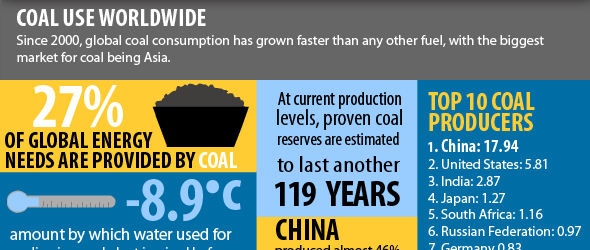
Infographic: China Leads Top 10 Coal Producing and Consuming Nations
Since 2000, global coal consumption has grown faster than any other fuel, with the biggest market for coal in Asia. Although China tops the global list for both coal consumption and production, the nation has emerged as the world's leading builder of clean coal technology.
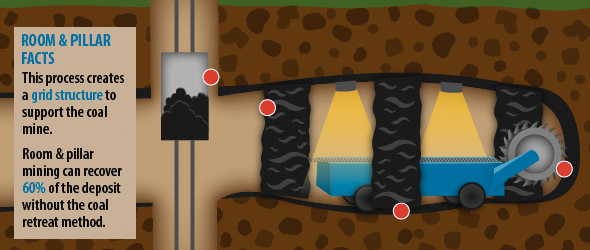
Infographic: Three Types of Coal Mining — Process and Facts
Opencast mining involves scraping at the ground's surface, while room and pillar mining occurs below ground. Likewise, longwall mining uses heavy machinery to dig at coal seams beneath the surface: learn more in this interactive inforgraphic.
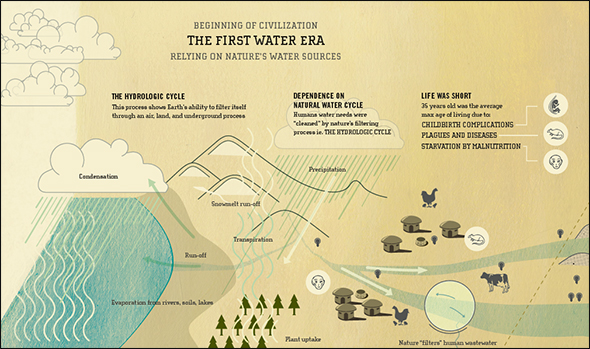
Infographic: Three Eras of Water — The History of the Relationship Between Civilization and Nature
The infographic portrays the evolution of water technology, including its immediate successes of human progress and the disadvantages of that progress. Based on an essay by Peter Gleick, the scientific, social, and historical findings are translated into this piece, putting those patterns in a contemporary light.
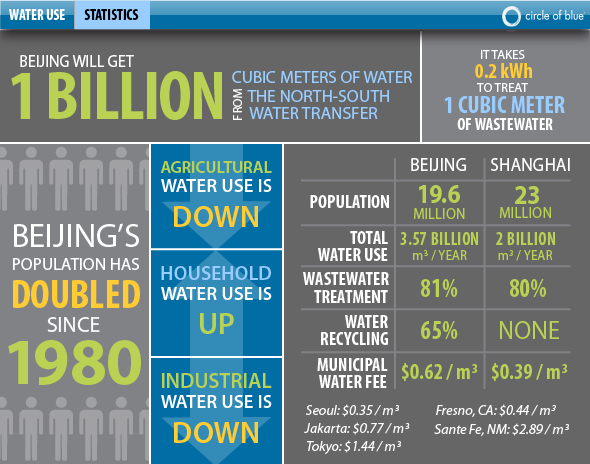
Infographic: Beijing Water Use and Population Statistics
The population of China's capital has doubled since 1980, and, though agricultural and industrial water use is down, municipal use is up.
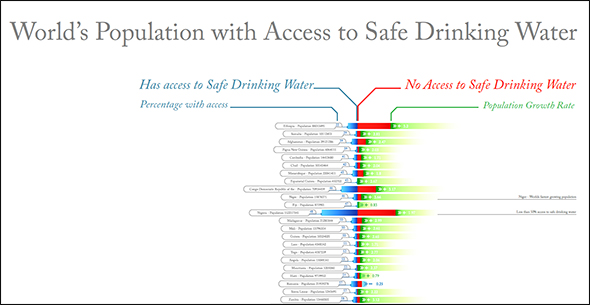
Infographic: World’s Population with Access to Safe Drinking Water
Entry in the 2011 Urban Water Design Challenge, sponsored by…

Event Invitation—Choke Point: Confronting Energy Demand and Water Scarcity in China
Circle of Blue and the China Environment Forum at the Woodrow Wilson International Center for Scholars will give an absorbing presentation on the energy-water choke points that are tightening around the world’s two largest economies. Please RSVP for May 6, 2011 from 9:00 a.m. - 11:00 a.m.
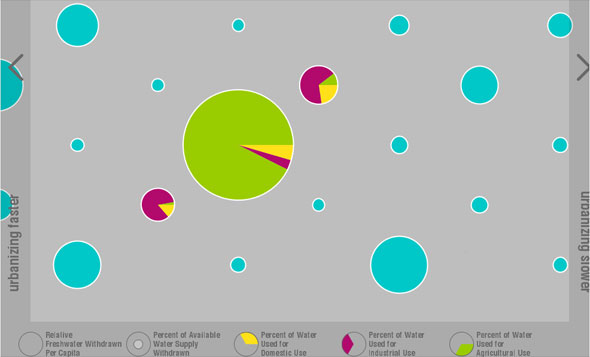
Infographic: Breakdown of Water Consumption and Use in Fastest-Urbanizing Countries
The relative water consumption per capita, percent usage of available freshwater in each country, and the respective breakdowns of use in agricultural, municipal, and industrial sectors are shown for the 120 fastest-urbanizing countries.

Peter Gleick: Where Have All Our Drinking Water Fountains Gone?
Where have all our drinking water fountains gone? They have been…

Ned Breslin: Lasting Coverage — Retooling the WASH Model’s “Beneficiary” Indicators (Part II)
So if “beneficiaries” are a terrible indicator of success in the international water, sanitation, and hygiene (WASH) sector, then what should take their place?

Q&A: Ma Jun on China’s Economic Development and Water Resources
Ma Jun tells Circle of Blue that China is still on the track of a highly energy- and resource-intensive model, with the need to de-couple economic growth from the expansion of resource consumption


